
Problem Statement
Let’s assume that in the market of one product, the demand function D(t) and the supply function S(t) are linear functions of the price P(t) at time t or the price P(t-1) of the previous point in time.
Demand function:
D(t) = α + A* P(t), (7-1)
where α, A are constant parameters.
Offer function:
S(t) = β + B * P(t –1), (7-2)
where β, B are constant parameters.
If we equate the formulas (7-1) and (7-2), we get the conditions of stability of the process – a linear equation where the price acts as a variable :
P(t) = (B/A)*P(t – 1) + (β – α /A) (7-3)
The equilibrium price P*, at which P(t) = P(t – 1), according to the above formula, is:
P* = (β – α) / (A – B), (7-4)
and, therefore, the condition determining P(t) → P* at t → ∞ , are the inequalities:
-1 < < 1 ; < 1. (7-5)
Confirmation of the condition that the process has converged, we will consider the fulfillment of the condition P (t) – P (t – 1) < ε for some fairly small positive value of the ε.
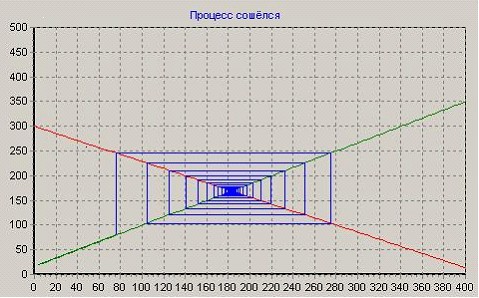
The computational procedure is based on the use of the BASIC 4 iterative computing program. To get a clear result, it is recommended to enter the following values A and B into the program:
Option 1: case of convergence A = 1.4 , B = 1.2 , P(0) = 80
With A > B, the market price, moving alternately up and down counterclockwise, draws a broken one corresponding to this cycle. As a result, P(0) reaches an equilibrium value of P*. It should be noted that fluctuations in market prices and the number of transactions move sequentially. Since, after an increase in prices, the number of transactions immediately increases and vice versa.
Option 2: divergence case A = 1.2 ; B = 1.4 ; P(0) = 80
With A < in – prices and the volume of transactions “run away”, changing with increasing amplitude.
Naturally, you can choose other values. Let’s try to experiment.
Additional examples. Analysis of the results obtained
Option 1.1: increase the base price, P(0) = 100
A given price level reaches the equilibrium level – the process converges.
From the resulting chart it follows that at higher prices the amplitude of fluctuations in the parameters of the task is markedly reduced, we will consider option 1 to be the base level, therefore, the situation on the market is more stable. In this case, production costs can be the same (both with an increase in prices and the volume of transactions, and when they decrease) and act as a price limiting factor to achieve the planned level of profit.
Option 1.2 will reduce the base price, P(0) = 40
A given price level reaches the equilibrium level – the process converges.
The dimensions of the “web” in Example 1.2 are much larger than the dimensions in Example 1.1. Consequently, the following dependence is observed: the price level is the opposite of the interval of oscillation of indicators, since when it decreases , the interval of change in price indicators and the volume of transactions (sales) increases and decreases at a higher initial price. Pricing policy, in this situation, should be carried out without additional investments (even in encouraging demand), despite the fact that the phase of falling sales is quite sensitive, and during this period all sorts of existing benefits (for example, preferential prices) should be omitted.