In practice, not only the values of the predicted value for objects similar to the object of forecasting or this value itself in the past are most often known, but also other values that affect the predicted value or change together with it. In this case, they say that there is a connection between these values and the use of knowledge about this relationship can significantly improve the accuracy compared to forecasting on a sample.
Consider the simplest case of pair dependence, when there is a predicted value and only one value affects it.
Let’s denote the desired predicted quantity through Y and call the dependence a variable, and the alternating variable through X and call it an independent variable.
The relationship between the dependent and the independent variable can be functional, in this case, each value of the independent variable corresponds to one specific value of the dependent variable, graphically such a connection is expressed by a line on the graph. The second type of connection is a probabilistic (stochastic) relationship, in which case several values of the dependent variable correspond to one value of the independent variable. Graphically, a probabilistic relationship can be represented as a certain point cloud (Fig. 12). Moreover, the frequency of occurrence of different values of the variable Y at the same value ![]()
![]() obeys some law, i.e. has a certain type of distribution, the same in the entire range of values of the independent variable.
obeys some law, i.e. has a certain type of distribution, the same in the entire range of values of the independent variable.
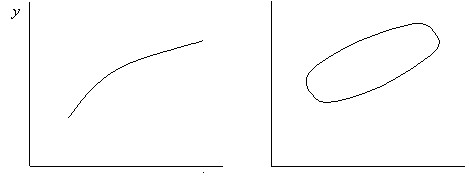
Fig.12. Functional (a) probabilistic (b) connection of variables.
The regression equation is used to describe the probabilistic relationship of variables. In the ideology of regression analysis lies the idea of all possible values of variables X and Y as random deviations from their average values ![]()
![]() and
and ![]() .The regression equation establishes a relationship between the deviations of the dependent and independent variables from their average values. It should be emphasized that in regression analysis we are talking about the relationship (a certain degree of jointity of change) Y and X, and not the dependence of Y on X. In other words, regression analysis does not establish the fact of the influence of X on Y, in fact it can be the opposite influence – Y affects X, or both the variables Y and X depend on the third or third variables. In all these cases, there will be some consistency in the change in the X and Y values, and this consistency can be established using the regression equation.
.The regression equation establishes a relationship between the deviations of the dependent and independent variables from their average values. It should be emphasized that in regression analysis we are talking about the relationship (a certain degree of jointity of change) Y and X, and not the dependence of Y on X. In other words, regression analysis does not establish the fact of the influence of X on Y, in fact it can be the opposite influence – Y affects X, or both the variables Y and X depend on the third or third variables. In all these cases, there will be some consistency in the change in the X and Y values, and this consistency can be established using the regression equation.
The term regression was introduced in the century before last as a result of studying the effect of parental growth on the growth of children. There is a widespread opinion that tall parents have tall children. Checking on a large statistical material showed that, on average, children of tall parents have a height less than the height of parents, i.e. the growth of children of tall parents regresses, tends to return to average height. And the growth of children of short parents is progressing – it tends to approach the average height.
Most often in practice, a linear law is used to describe the relationship between X and Y. Accordingly, they talk about a paired linear regression dependence, with its help the relationship between the dependent and independent variables is described as follows:
![]()
![]()
where:![]()
![]() ,
, ![]() are the coefficients of the regression equation;
are the coefficients of the regression equation;
![]()
![]() – Residual term.
– Residual term.
Thus, the random variable Y appears to consist of two parts:
a theoretical value that can be calculated from a known value of X using the ![]()
![]() formula ;
formula ;
and a residual term ![]()
![]() which is a random component that cannot be predicted and whereby the relationship between the dependent and independent variables is probabilistic.
which is a random component that cannot be predicted and whereby the relationship between the dependent and independent variables is probabilistic.
Among the reasons for the appearance of a ![]()
![]() random component may be the following:
random component may be the following:
– the absence in the regression equation of other independent variables affecting the dependent variable and not included in the equation due to their ignorance or lack of the possibility of reliable measurement;
– aggregation of a dependent variable from several homogeneous, but still different from each other variables (profit for an enterprise is the sum of profit for individual products produced by this enterprise, and these are similar, but still different economic categories);
– the discrepancy between the chosen theoretical dependence between the dependent and the independent variable of the actual dependence;
– Measurement errors of both dependent and independent variables.
In all these cases, errors occur that lead to the occurrence of a random component.
The general forecasting scheme using a regression dependency is as follows. According to the existing set of pairs of values and it is necessary to ![]()
![]() find the parameters of the regression equation, and then using the resulting equation and the new value of the independent
find the parameters of the regression equation, and then using the resulting equation and the new value of the independent ![]() variable, calculate the predictive value of the dependent variable
variable, calculate the predictive value of the dependent variable![]() .
.![]()
![]()