It is common to define the standard of living, first of all, as a set of products and services that an individual, family, or social group consumes.
In a broad sense, the concept of the standard of living includes, in addition to consumption, living conditions, health, education, morality and the use of free time by a person. Living conditions, in turn, include the state of the natural environment, working and living conditions.
The most important components of the standard of living are the incomes of the population and its social security, their consumption of material goods and services, living conditions, free time.
The standard of living is studied in relation to the entire population, to its social groups; to households with different incomes.
Analysis of the standard of living of the population is studied using the following main indicators:
income indicators of the population; indicators of expenditures and consumption of material goods and services by the population; savings; indicators of accumulated property and housing for the population; indicators of income differentiation of the population, the level and boundaries of poverty; generalizing assessments of the standard of living of the population.
These indicators provide a quantitative assessment of the standard of living. For the qualitative characterization of the living conditions of the population, the following indicators of demographic and social statistics are used:
infant mortality rate; health and safety indicators; indicators of the quality and structure of food consumed; the level of literacy and the state of education and culture; the level of comfort of housing.
With the help of a system of indicators of the standard of living of the population:
1) a system of standards related to the incomes and expenditures of the population is developed (minimum wage, minimum labor and social pensions, minimum scholarships and other minimum consumer budgets, a minimum set of publicly available and free services in the field of education, health, etc.).
Existing standards reflect modern ideas about people’s needs for minimum goods and services or for minimum personal needs.
Personal needs are divided into:
physiological (food, clothing, housing); intellectual (education, qualifications, creative activity); social (socio-political activity, provision of social rights).
2) the processes of stratification of the population by the level of income and consumption are studied, the influence of various socio-economic factors on their dynamics is determined;
3) international comparisons of the standard of living of the population by countries and territories are carried out;
4) a comprehensive study of the dynamics and structure of indicators of the standard of living is carried out both in the population as a whole and in individual social groups, households with different incomes;
5) the social policy of the state is developed, and the priority directions of social support for certain groups of the population are determined.
To quantify the dynamics of the standard of living and conduct its comparative analysis, the following generalizing indicators are used: gross domestic product, national income and net national disposable income. A measure of gross domestic product in real terms (in comparable prices) per capita is often used. For international comparisons, this indicator is estimated in United States dollars on the basis of purchasing power parity of the currency.
Since these cost indicators have some drawbacks (gross domestic product includes the cost of maintaining the state apparatus, the army, which is not always directly related to the standard of living of the population), therefore, relative qualitative indicators are proposed (child or maternal mortality rate, average life expectancy, etc.).
It should be noted that in order to characterize the provision of living standards, specialists of international organizations in the last decade of the twentieth century developed and approved the following criteria for the standard of living (in 1993 US dollars at PPP):
poverty – up to $ 1 / day, or $ 0.4 thousand / year; poverty – $ 2 / day, or about $ 1 thousand / year; the subsistence level is 4 dollars / day, or about 1.5 thousand dollars / year.
Such criteria are considered guidelines for social guarantees of people’s development at present. Governments are designed to provide these guarantees to the populations of their countries. It should be noted that according to world bank estimates, in 1993 1.2 billion people lived at the level of poverty of our planet, and another 2.4 billion people lived at the level of poverty.
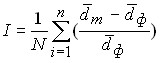
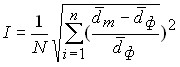
A single aggregate indicator of the standard of living is being developed. One of them can serve as a human development index (HDI) developed by specialists of the United Nations Development Programme, which reflects both the well-being and quality of life of the population of a particular country. This combined indicator, combining the values of the indices of longevity, education, living standards and employment of the population, allows you to adjust monetary estimates of human resources when comparing the indicators of different countries. It is calculated as the arithmetic mean of the three most visual indicators of living standards:
![]()
![]() ,
,
where ![]()
![]() is the index of the average life expectancy of the population;
is the index of the average life expectancy of the population;
![]()
![]() – index of the level of education of the population:
– index of the level of education of the population:
![]()
![]() ,
,
where ![]()
![]() is the adult literacy index;
is the adult literacy index;
![]()
![]() – index of the total proportion of pupils in primary, secondary and higher education institutions;
– index of the total proportion of pupils in primary, secondary and higher education institutions;
![]()
![]() – the index of real gross domestic product per capita (in US dollars).
– the index of real gross domestic product per capita (in US dollars).
According to the methodology, when calculating each of the components of the composite index, fixed standards of minimum and maximum values are used, with which the actual indicators for the country are compared:
![]()
![]() .
.
The principle of calculating each component of the composite index is to assess the relative distance between its actual value and the maximum, which is the ultimate goal of development (age – 85 years, access to education for all, ensuring a decent level of income). The (higher) the HDI value to one, the higher the human development of a given country.
Between 1960 and 1995, the HDI, calculated as the world average, increased by 247 points (the level of real gross domestic product increased by 1.8 times, the age rose from 50 to 64 years, the literacy rate among the population rose to 50% in the least developed countries). Norway is in the first place, its HDI level in 2000 is 0.942. In the top ten for 35 years are Canada, France, Norway, USA, Iceland, Sweden, the Netherlands. Slovenia is on the 37th place, Poland on the 52nd. The Republic of Belarus is on the 53rd place, the Russian Federation – on the 60th place.
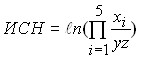
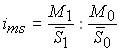
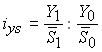
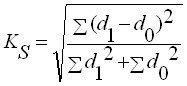
The composite indicators of the standard of living of the population include the index of social disadvantage (ISN):
 ,
,
where ![]()
![]() is the work;
is the work;
![]()
![]() – number of deaths;
– number of deaths;
![]()
![]() – the number of man-days lost due to strikes;
– the number of man-days lost due to strikes;
![]()
![]() – number of registered unemployed;
– number of registered unemployed;
![]()
![]() – number of registered crimes;
– number of registered crimes;
![]()
![]() – number of registered divorces;
– number of registered divorces;
![]()
![]() – number of births;
– number of births;
![]()
![]() – purchasing power of the average wage.
– purchasing power of the average wage.
The smaller the ISN, the more socially prosperous society is.
It should be noted that the methodology developed by UNDP specialists for calculating the HDI currently summarizes numerical information from 175 countries from 220 countries of the world; it is more than representative of the totality of countries. First, they present groupings of countries with low, medium and high levels of human development, which reflect the differences between countries in terms of the level of GDP per capita created in them, as well as components: the level of average life expectancy of their population and its education. Secondly, for each group of countries, countries with a level of poverty and misery are distinguished. For these countries, a methodology has been developed for calculating a special “population poverty index” (TIN), which serves to monitor the implementation of the UN program to combat poverty and misery. It is quite obvious that in groups of countries with a medium and high level of human development, there are the greatest opportunities for expanded reproduction.
It should be noted that to measure the level of poverty, UNDP has developed two versions of the indices: INN1 – for the population of developing countries (a group with a low level of development) and INN2 – for industrialized countries (medium and high level of development). The differences in the calculations of such indices consist in additional estimates of “deprivation”, that is, in the identification of population groups with lower than the national average values of the components of the index.
According to the SNA methodology, the income scorecard is based on the following. Income is the maximum amount that can be used for consumption and accumulation per year, without reducing the available savings (property, savings) at the beginning of the year. For example, income cannot be considered amounts associated with the sale of real estate, currency, vehicles, since this is simply the transfer of tangible assets into financial ones and vice versa, if these purchases are associated with previously available savings. Nor is the amount of money that must be spent on the purchase of the spent means of production.
The SNA provides for the following system of household income indicators, reflecting the different stages of the income distribution process:
primary income; current transfers in cash form; disposable income; social transfers in kind; adjusted disposable income.
Of great importance is the analysis of data on the incomes of the population, which involves the study of the structure of income by type: income from employment, income from entrepreneurial activity, income from property. To this end, households are divided into households of persons:
employed persons; entrepreneurs; self-employed (persons of free professions); living on transfers; living on property income.
Currently, in the republic, one of the main sources of information on incomes and expenditures of the population is the balance of monetary incomes and expenditures of the population, which has the following form.
The balance of monetary incomes and expenditures of the population serves as the main tools for analyzing the standard of living and establishes the degree of balance between income and consumption of the population.
Other income: income of the population from officially unrecorded business activities; income of the population from the sale of agricultural products in the markets, from the sale of currency, the balance of money received from transfers and letters of credit.
Table 38
Balance of cash income and expenses
Monetary incomes of the population | Cash expenditures of the population |
Wages Property income Income from the financial system Transfers Other | Shopping Payment for services Mandatory payments and voluntary contributions Increase in savings Balance of money sent by transfers and letters of credit |
There are the following types of income of the population:
real total incomes; real disposable incomes; total income; personal income; personal disposable income; cash income.
Nominal income is divided into gross and net.
Real Income ![]()
![]() Index :
Index :
 ,
,
where ![]()
![]() is the index of nominal incomes;
is the index of nominal incomes;
![]()
![]() – composite index of consumer prices:
– composite index of consumer prices:
![]()
![]()
![]()
![]() – the index of the purchasing power of money (characterizes the change in the volume of goods and services that can be purchased for the same amount of money in the reporting period compared to the basic one).
– the index of the purchasing power of money (characterizes the change in the volume of goods and services that can be purchased for the same amount of money in the reporting period compared to the basic one).
Real income index per capita:
 ,
,
where ![]()
![]() is the index of the average annual population.
is the index of the average annual population.
The average amount of accrued wages and the average size of the monthly pension, taking into account compensation, are also calculated.
In connection with inflation or depreciation of money, the incomes of the population are subject to indexation. Indexation is a mechanism established by the state to increase the monetary incomes of the population, which allows it to partially compensate for the rise in price of consumer goods and services as a result of inflation. Incomes of the population received from the state budget are subject to indexation. In the extrabudgetary sphere, the increase in monetary incomes of the population is usually carried out by compensating for the direct revision of rates and salaries when concluding collective agreements.
Monetary incomes of the population from property are not subject to indexation, since they are formed in conditions of free pricing and do not need additional protection. Inflation of monetary incomes of the population in the Republic of Belarus is measured using the consumer price index.
The consumer price index is calculated according to a constant set of goods and services (consumer basket) based on the fact that the nature of consumption of the population will be constant.
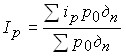 ,
,
where ![]()
![]() – individual price indices for goods by the representative;
– individual price indices for goods by the representative;
![]()
![]() – the number of goods of the consumer basket;
– the number of goods of the consumer basket;
![]()
![]() – basic prices.
– basic prices.
To analyze the socio-economic differentiation of the population, it is distributed according to the level of per capita monetary income. For these purposes, data obtained from sample budget surveys of households are used.
Based on these data, the following are calculated:
modal income – the level of income most common among the population; median income – located in the middle of the series of distribution of the population by income level; the decile (quintile and quarterly) coefficient of income differentiation of the population is the ratio of the minimum incomes of the 10% (20-25%) of the richest population to the maximum incomes of the 10% (20 and 25%) of the poorest population.
 ,
,
where ![]()
![]() ,
, ![]() is the ninth and primary decile.
is the ninth and primary decile.
Similarly, the coefficients of the funds are calculated:
the decile coefficient of funds is the ratio between the average incomes of the population in the 10th and 1st decile groups:
 ,
,
where ![]()
![]() is the average per capita income for 10% of the most or less well-off population.
is the average per capita income for 10% of the most or less well-off population.
The higher the standard of living in the country, the lower this indicator.
Lorentz Social Inequality Coefficient (![]()
![]() ):
):
 .
.
Gini Social Inequality Rate (![]()
![]() ):
):
![]()
![]() ,
,
where ![]()
![]() is the cumulative (accumulated) share.
is the cumulative (accumulated) share.
In the statistical study of the level and boundaries of poverty, a limit of income is established that ensures consumption at the minimum permissible level.
The minimum income (subsistence minimum) or poverty line is the level of income that provides a minimum set of material goods and services.
It includes expenditures on food products based on their minimum consumption, minimum expenditures on non-food goods and services, as well as taxes, mandatory payments. At the same time, the structure of expenditures on them in 10% of the population of wealthy families is taken into account. According to the methodology of the UN Regional Commission for Europe, the poorest segments of the population include persons whose per capita income does not exceed ![]()
![]() the national average. There are two approaches to determining the subsistence minimum (poverty line):
the national average. There are two approaches to determining the subsistence minimum (poverty line):
1) statistical – the cost of actual consumption of 10-15 or 30% of the population with the lowest incomes is considered as a subsistence minimum;
2) normative – when, according to the minimum consumption standards determined by state structures, a conditional “consumer basket” of goods and services at current prices is drawn up (it can be constant for 10-15 years).
The minimum food “basket” is developed both for the entire population and for its individual sex and age groups (consumption of bread products per year for the entire population – 130.8 kg, for men – 177 kg, women – 124.9 kg, pensioners – 119 kg, 0-6 years – 64.4 kg).
Taking into account the fact that there are territorial differences in the structure of consumption, in Russia the structure of the minimum consumer basket is differentiated by eight natural and climatic zones.
The cost of the minimum “consumer basket” is determined by the product of the standard of per capita consumption for each product by its average (or most “running”) price. On its basis, the consumer price index is determined, standards for wages and cash payments from the budget are developed, and the dynamics of the standard of living in the country is studied.
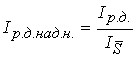
Based on the actual per capita income of the poor and the minimum per capita income, the following indicators are calculated:
1) income deficit – the amount of income of the population missing to the subsistence minimum:
![]()
![]() ,
,
where ![]()
![]() are the average per capita incomes are minimum and actual;
are the average per capita incomes are minimum and actual;
![]()
![]() – the number of people who have per capita incomes below the subsistence minimum.
– the number of people who have per capita incomes below the subsistence minimum.
2) poverty depth index:
 ,
,
where ![]()
![]() is the total number of households surveyed;
is the total number of households surveyed;
n – number of households with per capita income below the minimum income.
3) poverty severity index:
 .
.
4) low income period – the share of the income deficit to the subsistence level (A);
5) poverty level – the share of the population with incomes below the subsistence minimum (W);
6) Synthetic poverty indicator:
![]()
![]() ,
,
where ![]()
![]() is the Gini coefficient,
is the Gini coefficient,
![]()
![]() – [0; 1].
– [0; 1].
If all members of society have incomes above the subsistence minimum, ![]()
![]() = 0; if all have minimum incomes,
= 0; if all have minimum incomes, ![]() = 1.
= 1.
An integral part of the system of indicators of the standard of living is the consumption of products and services by the population. It is characterized by indicators of volume, composition, dynamics of consumption in physical and value terms, by classes, social groups, territory, industries, types of consumption.
A valuation of the population’s consumption of products and services is shown in the “Use of income” account of the SNA. Actual final household consumption is household spending on “non-durable” goods and services used directly to meet people’s current individual and collective needs.
These costs (needs) are studied on various grounds:
by the nature of expenditures, consumer spending (at the expense of the population’s money), expenditures of the state budget, non-profit public organizations, at the expense of voluntary contributions and income from property are distinguished; by type of consumption – consumer products (food and non-food) and services (paid and free). Free – health, education, cultural services, consumption of products and services by the population that is fully supported by the state (conscripts; persons living in boarding schools, orphanages, prisons, etc.); by purpose of use – products, goods, housing consumption, utilities, health services, culture, education, recreation; through the channels of receipt – retail trade, collective farm market, budget institutions, consumption of products of own production.
A special place belongs to the analysis of consumption in kind, where the following groups of indicators are distinguished:
having natural units of measurement and relating to each person; conditionally natural indicators of the nutrient content of substances in products and indicators of household energy supply; availability of durable goods belonging to households or to 1000 people of the population.
The volume of consumption of products and services is determined by the prices of actual acquisition, i.e. when buying in a retail network – retail, when buying on the kolkhoz market – at market prices, when receiving “free” services – at costs.
In addition to the total volume of consumption, per capita consumption of products and services of everything and by type is calculated both in relation to the entire average annual population and for its individual social groups.
When valuing consumption, current and comparable prices are used in dynamics.
There are certain features in the calculation of indicators of consumption of food and non-food products, as well as services.
One of the most important characteristics of the standard of living of the population is the share of expenditure on food in the total expenditure of the population. As the standard of living rises, it decreases, which allows more money to be spent on leisure, health care, etc. (industrialized countries ![]()
![]() 20%, Belarus – 57.5%).
20%, Belarus – 57.5%).
The amount of expenditure on food is equal to the volume of consumption of food products by the population. Indicators of food consumption are calculated per capita (per year) in value, in-kind and conditionally natural terms. Conversion into conditionally natural meters is carried out on the basis of the conversion factor. For example, meat and meat products are converted to meat; milk and dairy products – for milk.
There are ten main food groups, the consumption of which per capita is determined per year:
meat and meat products; milk and dairy products; eggs; fish and fish products; sugar; vegetable oil; potatoes; vegetables and melons; fruits and berries; bread and bakery products.
Natural indicators of consumption of basic food products per capita are difficult to compare for individual territories, since they depend not only on production volumes, but also on climatic conditions, nationality and cultural traditions, the share of urban and rural population. When comparing them in dynamics and in space, it is necessary to take into account the gender and age composition and occupation of the population (physical, mental labor, etc.).
In order to take into account these features, calculation coefficients are used, the actual indicators of per capita consumption of food products are transferred to conditionally consumer units. There is a scale of conversion factors that includes six consumption conversion factors: for children (from 02 to 0.98); 4 conversion rates for adults according to sex, age and occupation (0.9; 1; 1.1; 1.2).
The consumption of an adult male engaged in mechanized labor is taken as a unit. Consumer conversion rates for food for women are lower than for men by about 15%, and for consumer goods are higher by about 30%.
Satisfaction of the population’s needs for food can be measured not only in natural physical units, but also in terms of the caloric content of the daily diet with the release of proteins, fats and carbohydrates.
Recently, it was still believed that in terms of the total caloric content of the population (more than 3000 kcal per day on average per person), the Republic of Belarus is at the level of the developed countries of the world. Over the past 5 years, the total caloric intake has sharply decreased (2300 kcal). For some consumer products, it does not meet not only rational, but even minimal standards (meat and meat products, milk and dairy products, fruits and berries, vegetables and melons, fish, butter), i.e. a predominantly carbohydrate model of nutrition has developed – bread products, cereals, sugar, potatoes. In the developed countries of the world, they switched to protein-vitamin nutrition with a high content of proteins, amino acids, vitamins.
The calculation of indicators of consumption of non-food products has its own characteristics. When characterizing the consumption of short-term goods (clothing, footwear, fabrics, hosiery), indicators are calculated in physical terms per capita.
To characterize the consumption of durable goods, indicators of their availability per 1000 people or per 100 households are used.
The calculation of the indicator of the total volume of services is based on the assessment of all types of market and non-market services.
Consumption of market services is studied in the following areas:
rent and utilities, payment for household services, services of preschool and out-of-school institutions, expenses for the purchase of vouchers, for treatment and physical culture and sports, expenses for cinema, theaters, entertainment, passenger transport, including urban, communication services; household services include the repair of shoes, clothing, furniture, transport, housing, construction by individual orders; hairdressing services, etc.; transport services, all types of services for the transportation of the population, as well as goods for the population; other services – legal services (legal advice, notary offices), state insurance services and savings banks.
The study of the dynamics of consumption of products and services is carried out with the help of indices. At the same time, the dynamics of consumption is studied both in the context of individual types of consumption and in the entire volume of consumption.
Individual indices of consumption of products and services:

 ;
; ![]()
 ;
;  ;
; ![]() ,
,
where ![]()
![]() is the product;
is the product;
![]()
![]() – average annual population;
– average annual population;
![]()
![]() – service.
– service.
Index of total consumption of products and services:
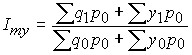 ,
,
where ![]()
![]() are the values of the consumed products in constant prices;
are the values of the consumed products in constant prices;
![]()
![]() – the cost of consuming services in constant prices.
– the cost of consuming services in constant prices.
This indicator can be calculated per capita:
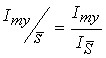 ;
; 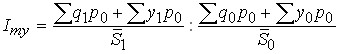 .
.
The most important task of statistics is to study the structure of consumption of the population. Engel’s law: the lower the income, the greater the share of food expenses.
Gini’s Law: If food expenditure rises or falls in an arithmetic progression, other types of expenditure tend to change exponentially in the opposite direction.
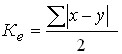
To assess structural differences in consumer spending, the integral coefficient of structural shifts is used:
 or ,
or , 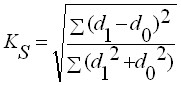
where ![]()
![]() are the shares of certain types of household expenditures, in their total volume, in the reporting and base periods or of one social group in relation to another.
are the shares of certain types of household expenditures, in their total volume, in the reporting and base periods or of one social group in relation to another.
If ![]()
![]() = 0, then the structures being compared are no different;
= 0, then the structures being compared are no different; ![]() = 1, then they are different.
= 1, then they are different.
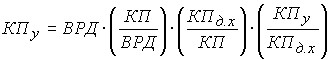
Factors that have a significant impact on the volume of consumption include:
indicators of total production in the country; distribution indicators; indicators of the use of the received reserves.
Factors can be studied by building multifactor index models:
 ,
,
![]()
![]() ,
,
 ,
,
![]()
![]() ,
,
where ![]()
![]() is the final consumption of households;
is the final consumption of households;
![]()
![]() – final consumption of non-market public administration services;
– final consumption of non-market public administration services;
![]()
![]() – the volume (income) that the country has for final consumption and accumulation;
– the volume (income) that the country has for final consumption and accumulation;
![]()
![]() – the nature of the distribution, what part goes to saving and how much to consumption;
– the nature of the distribution, what part goes to saving and how much to consumption;
![]()
![]() – distribution of final consumption between the population and the state;
– distribution of final consumption between the population and the state;
![]()
![]() – the share of non-market services provided by the state to the population in the final consumption of households.
– the share of non-market services provided by the state to the population in the final consumption of households.
The overall change in final consumption for the general government sector is determined by:
![]()
![]()
![]()
![]() .
.
The change due to each of the selected factors will be determined as follows:
![]()
![]()
![]()
![]()
![]()
![]()
![]()
![]() .
.
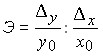
To quantitatively reflect the relationship between the dynamics of incomes or prices and the level of consumption of individual goods, an elasticity coefficient (E) is calculated, which shows how much the level of consumption changes with a change in per capita income (price) by 1%:
 or ,
or , 
where ![]()
![]() is the absolute change in per capita consumption;
is the absolute change in per capita consumption;
![]()
![]() – absolute change in per capita income (price).
– absolute change in per capita income (price).
E<0 – with rising incomes, the consumption of such goods decreases;
0<E<1 – low elasticity;
E1![]()
![]() – medium elasticity;
– medium elasticity;
E>1 – high (industrial goods of limited demand – household appliances, jewelry, vehicles; food products – cheese, meat, fruits).
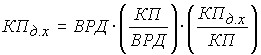
The volume and structure of consumption is determined not only by the total amount of incomes of the population or their per capita value, but also by the situation in the consumer market, the degree of saturation with individual goods, the ratio of prices for them. To do this, an indicator of the purchasing power of monetary incomes of the population is calculated. It characterizes the number of certain goods and services that can be purchased with an average per capita monetary income:
 ,
,
where ![]()
![]() is the average per capita monetary income;
is the average per capita monetary income;
![]()
![]() – the average price
– the average price ![]() of the goods.
of the goods.
Security questions
Define the concept of “standard of living”. What is studied with the help of the system of indicators of the standard of living? What is an HDI? How to calculate THE IIT? How to calculate the consumer price index? How to determine the index of total consumption of products and services?