Population statistics (demographic statistics) studies the patterns of quantitative changes in population. In accordance with this main task, it studies: the size, composition and movement of the population; causes and factors of population change, its migration, birth rate, mortality, life expectancy. It studies the composition of the population on various grounds – sex, age, social status, education.
Objectives of population statistics:
study of the number, location, demographic and socio-economic composition; analysis of reproduction and population dynamics; determination of the prospective size of the entire population and its individual contingents.
Population size is the baseline for calculating many indicators and is of great economic and social importance. Knowledge of it is necessary for the management, planning of economic and social development of the country. The size of the country is usually judged by the size of its population.
The population is constantly changing due to fertility and mortality, as well as due to the spatial displacement of the population.
The population is determined by the state at a certain point in time, i.e. as a result of censuses. The census is now the main method of accurately determining the population. However, censuses are relatively rare and population data are required at all times. Therefore, in the periods between censuses, the statistical authorities carry out the so-called current population estimate, i.e. they carry out a calculation based on the data of the last census and the materials of current statistics on the movement of the population. Its calculations are specified on the basis of the results of the next census.
There are two categories of population taken into account in the conduct of population censuses: permanent settlement and the actual population. Permanent population includes persons who usually reside in a given locality, and cash – all persons who were at a critical time of the census in this territory, regardless of whether they reside permanently or temporarily. In order to determine the size of the resident population, the census takes into account the temporarily absent and temporarily residing. Temporarily absent are permanent residents of this settlement who have temporarily left it. Thus, the temporarily absent are part of the permanent population. Temporary residents make up a part of the available population.
The number of permanent population can be determined:
![]()
![]() ,
,
where ![]()
![]() is the present population;
is the present population;
![]()
![]() – temporarily absent;
– temporarily absent;
![]()
![]() – Temporarily arrived.
– Temporarily arrived.
Of great importance in population statistics is the average population. The average population can be calculated by different methods. The most accurate is the method of man-years lived by the population. In this case, the total number of person-years lived by this population for the studied period of time is determined and divided by the length of this period. Often the average annual population is defined as the half-sum of its number at the beginning and end of the year.
![]()
![]() ,
,
where ![]()
![]() is the population at the beginning of the year;
is the population at the beginning of the year;
![]()
![]() – population at the end of the year.
– population at the end of the year.
If there are data for several dates equal to each other, the calculation ![]()
![]() can be made according to the formula of the average chronological prime:
can be made according to the formula of the average chronological prime:
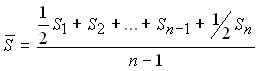 .
.
If the time distance between the dates is not the same, then the calculation is carried out according to the formula of the arithmetic (chronological) weighted:
 .
.
To calculate the change in population over time, dynamics indicators are calculated.
The population is the main material component of society and the study of the patterns of its development is of great importance for the country’s economy.
For each individual country, the total population can change due to two factors:
natural movement (births and deaths); migration (mechanical) movement.
However, not only the total population is changing, but also the composition.
Statistics currently use four complementary sources of population data:
population censuses; routine accounting of the vital movement of the population and its migration; sample and special demographic surveys; registers and various population registers.
The data from these sources are used for different purposes and cannot replace each other. However, there is a close relationship between them: each source complements or continues the other.
The main source of population data is the census, which is conducted 1 time in 10 years. Population counting in its implementation is carried out by settlements as of a certain point in time, which is called a critical moment.
When characterizing the dynamics of the population, two circumstances must be taken into account:
1) it is possible to compare the population of only one category (either permanent or cash);
2) if there have been administrative-territorial changes, the population data should be comparable in respect of the territory.
Total absolute population growth (![]()
![]() ):
):
![]()
![]() or ,
or , ![]()
where ![]()
![]() is the natural increase;
is the natural increase;
![]()
![]() – mechanical growth.
– mechanical growth.
At the same time ![]()
![]() ;
;
![]()
![]() ,
,
where ![]()
![]() is the number of births;
is the number of births;
![]()
![]() – number of deaths;
– number of deaths;
![]()
![]() – number of arrivals;
– number of arrivals;
![]()
![]() – Number of dropouts.
– Number of dropouts.
Then: ![]()
![]()
Both general and natural, and migration gains can be positive or negative. Absolute increases are interval indicators, they are calculated for certain periods of time (annual indicators are of the greatest importance).
Data on the population are presented in the territorial aspect (within the administrative-territorial units). Structural indicators are used to characterize the location of the population. These are: 1) the proportion of the population living in certain regions; 2) the indicator of physical density of the population, which is calculated as the ratio of the population to the area occupied by it (the largest population density – 15539 people. per 1 km2 – in Monaco).
One of the main characteristics of the distribution of the population is its division into urban and rural. According to the accepted classification, cities are divided into:
small – with the number of inhabitants up to 50 thousand; medium – 50-100 thousand; large – 100-250 thousand; large – 250-1 million; the largest – more than 1 million.
Studying the birth rate, mortality and natural population growth, statistics, first of all, determine their absolute size, i.e. establish the number of births, the number of deaths and the difference between these numbers, called the absolute indicator of natural population growth. These indicators are calculated for a certain period of time – a year, a month, etc.
Relative indicators are also calculated for these quantities, called coefficients.
Fertility rate per 1000 people:
![]()
![]() ,
,
where ![]()
![]() is the number of births;
is the number of births;
![]()
![]() – average population.
– average population.
Mortality rate per 1000 people:
![]()
![]() ,
,
where M is the number of deaths.
Natural increment coefficient:
![]()
![]()
or equal to the difference between the fertility rate and the mortality rate:
![]()
![]() .
.
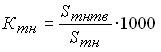
Coefficient of vitality of the population (Pokrovsky):
![]()
![]() ,
,
shows how many newborns there are per deceased.
Infant mortality rate (Raths formula):
 ,
,
where ![]()
![]() – those who died before 1 year;
– those who died before 1 year;
![]()
![]() – born;
– born;
![]()
![]() – Born in the year preceding this one.
– Born in the year preceding this one.
The specific fertility rate is calculated as the ![]()
![]() ratio of the number of births (
ratio of the number of births (![]() ) to the average number of women of reproductive age (15-49 years):
) to the average number of women of reproductive age (15-49 years):![]()
 .
.
The total fertility rate (n) is the product of the special fertility ![]()
![]() rate for women aged 15-49 in the total population (
rate for women aged 15-49 in the total population (![]() ):
):
![]()
![]() ,
,
where 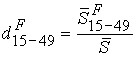 .
.
Migration balance: ![]()
![]()
Total absolute increase: ![]()
![]() .
.
Mechanical population growth rate:
![]()
![]() .
.
Total population growth rate:
![]()
![]() or .
or . ![]()
Among the indicators of the vital movement of the population include indicators of marriages and divorces. Indicators of population migration are also calculated. A distinction is made between immigration and emigration. Indicators of migration are the number of arrivals in a given settlement, departures and the difference between them – the balance of migration. The balance can be positive (mechanical population growth) and negative. The intensity of migration and emigration, as well as the relative change in numbers, is defined as the ratio of these indicators to the average population multiplied by 1000.
Labor resources are a part of the country’s population that has the necessary physical development, health, education, qualifications and professional knowledge to work in the national economy. Labour statistics study the following categories:
the working-age population; the working-age population of working age; Labour.
The size of a country’s labor force is primarily determined by the size of the working-age population.
Labor resources in general are potential labor resources. In addition to them, there are also existing (functioning or used) labor resources. This is part of the total labor resources employed in the national economy. The difference between potential and existing labor resources characterizes the absolute value of unused labor resources.
To characterize the age structure of the population in terms of labor resources, a number of relative indicators of structure and coordination are calculated. This is the proportion of persons younger than working age, working age and older than working age in the total population. The higher the proportion of persons of working age, the more efficient the age structure of the population is in terms of the labour force.
The able-bodied population is a set of people capable of working by age and state of health. The boundaries of working age are established by labour legislation. In the Republic of Belarus, the age is considered to be the able-bodied population: for men – 16-59 years; for women – 16 – 54. The rest of the population is considered incapable of work by age. It is divided into two specific groups: the population at the pre-working age (10-15) and the population in the post-working age (men 60 years and older, women 55 years and older). The first of them is a source of compensation for the loss and replenishment of labor resources in the future. The second is the “pension burden” on the working population.
The working-age population is not all capable of working. Therefore, it is divided into the able-bodied population and the disabled population of working age. Pupils of working age who study on a part-time basis in higher educational establishments and vocational schools and persons in military service do not participate in social production. In addition, they include the part of the population engaged in their household caring for children and other reasons).
The second group includes the population of working age who has I and II groups of disability and persons receiving a pension on preferential terms.
The number of labor resources is determined by the state of a certain point in time. When calculating a number of indicators, the average annual number of labor resources is used, which is determined similarly to the average annual population.
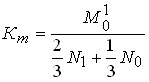
On the basis of these populations, two coefficients of working capacity are determined:
the entire population; of the working-age population.
Coefficient of working capacity of the entire population:
 ,
,
where ![]()
![]() – the able-bodied population of working age;
– the able-bodied population of working age;
![]()
![]() – the entire population.
– the entire population.
Working capacity of the working-age population:
 ,
,
where ![]()
![]() is the working-age population.
is the working-age population.
Aged dependency ratio:
 ,
,
where ![]()
![]() is the population of retirement age.
is the population of retirement age.
Labour substitution ratio:
 ,
,
where ![]()
![]() is the population of pre-working age.
is the population of pre-working age.
The total load factor (economy factor of the age composition) reflects the degree of pressure of the working-age population on the population of all non-working ages:
![]()
![]() or .
or . 
In addition to the able-bodied population, the employed population includes working pensioners (people of retirement age, but not retired; disabled persons of I and II disability groups), working adolescents under 16 years of age.
To characterize the change in the number of labor resources in time and the rate of its change, the absolute growth rate, the growth rate and the growth rate of labor resources are calculated.
The change in the number of labor resources from one date to another within a year is called the movement of labor resources. A distinction is made between the natural and mechanical movement of labor resources.
Natural movement consists of replenishment of potential labor resources due to the transition of the younger generation to the working age (15-16) and their loss as a result of:
the departure of some people beyond the limits of working age; transition to disability and pension on preferential terms; Death.
With mechanical movement, replenishment occurs due to immigration, and decline – due to emigration of the population.
The number of potential labor resources can be determined at the beginning and at the end of the year, taking into account and without taking into account the migration balance. the difference between the number of potential resources at the beginning and end of the year is an absolute natural increase (![]()
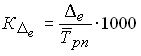
![]() ). To characterize the intensity of labor reproduction, the coefficient of natural increase is calculated (
). To characterize the intensity of labor reproduction, the coefficient of natural increase is calculated (![]() ):
):
 ;
; ![]() ,
,
where ![]()
![]() is the coefficient of natural replenishment;
is the coefficient of natural replenishment;
![]()
![]() – the coefficient of natural attrition;
– the coefficient of natural attrition;
![]()
![]() – average annual number of labor resources.
– average annual number of labor resources.
Natural replenishment ratio:
 ,
,
where ![]()
![]() is the natural replenishment.
is the natural replenishment.
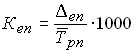
Natural attrition rate:
 ,
,
where ![]()
![]() is the natural disposal.
is the natural disposal.
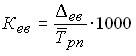
Then the coefficient of natural increase:
![]()
![]()
Indicator characterizing the supply and demand of labor – vacancy rate:
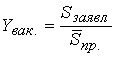 ,
,
where ![]()
![]() is the declared number for the necessary labor force;
is the declared number for the necessary labor force;
![]()
![]() – the average number of employees of the enterprise.
– the average number of employees of the enterprise.
The level of intensity of the expected release of labor:
 .
.
Unemployment rate:
![]()
![]() .
.
Important for the Republic of Belarus and its regions are indicators characterizing the age structure of the population in terms of labor resources.
Security questions
How to determine the average annual population? How to find the absolute population growth per year? How to determine the Pokrovsky coefficient? How to determine a specific fertility rate? Human resources, main categories. How to calculate the coefficient of pension burden of the population?