In order to measure the size and ratios of phenomena (i.e., to give them an appropriate quantitative characteristic), it is necessary to develop economic and social indicators corresponding to each concept. There are three types of indicators of economic and social development of society: planned; reporting; Evaluation.
Planned indicators are certain specific tasks for the development of the national economy as a whole or individual enterprises for certain periods of time.
The reporting indicators characterize the actual level of economic and social development actually achieved over a certain period.
Estimates are the result of a forecast calculation of the development of a particular phenomenon.
A statistical indicator is an objective quantitative characteristic (measure) of a social phenomenon or process in its qualitative certainty in specific conditions of place and time.
Each statistical indicator has a qualitative socio-economic content and a related measurement methodology.
A statistical indicator can take different forms:
express the total number of units of the population; the total sum of the quantitative feature values of these units; the average value of the feature; the magnitude of this feature in relation to the value of the other.
The statistical indicator has a numerical expression. The numerical expression of a statistical indicator, expressed in certain units of measurement, is called its value.
The value of the indicator usually varies in space and fluctuates in time. Therefore, a mandatory attribute of the statistical indicator is the indication of the territory (or population) and the moment or period of time.
Table 11 Resource requirements by component
Production and consumption of electricity in Belarus
in 1990-1999 (million kWh)
Years | 1990 | 1995 | 1997 | 1998 | 1999 |
Power generation | 39526 | 24918 | 26057 | 23492 | 26516 |
Consumption in the sectors of the national economy | 26974 | 26276 | 22524 | 18355 | 14993 |
Quality content – production and consumption of electricity; territory – Belarus; numeric values (values) – see Table 11; unit of measurement – million kWh; time – 1990-1999; statistical form of the indicator – the total sum of the value of the quantitative feature; calculation methodology – accounting for electricity production from all sources.
Statistical indicators can be conditionally divided into:
primary (volumetric, quantitative, extensive); secondary (derivative, qualitative, intensive).
Primary characterizes either the total number of units of the aggregate, or the sum of the values of any feature. Taken in dynamics, in time, they characterize the extensive path of development of the economy and culture. According to the statistical form, these indicators are total absolute values.
Secondary, derived indicators are usually expressed in average and relative values, and taken in dynamics, usually characterize the path of intensive development (for example, reducing the cost and labor intensity of a unit of production).
Depending on the units of measurement used, indicators are distinguished: natural, conditionally natural, value and labor.
Depending on the scope of application, there are indicators calculated at the national economic, regional, sectoral level, etc.
According to the accuracy of the reflected phenomenon, the expected, preliminary and final values of the indicators are distinguished.
Depending on the volume and content of the object of statistical study, individual (characterizing individual units of the population) and summary (generalizing) statistical indicators (production efficiency, quality of life) are distinguished.
Over time, some statistics may disappear and new ones may appear.
The construction and improvement of statistical indicators should be based on compliance with the following principles:
1) objectivity and reality, i.e. indicators should truthfully and adequately reflect the essence of the relevant economic or social categories;
2) comprehensive theoretical and methodological validity, i.e. determination of the value of the indicator, its measurability and comparability in dynamics should be comprehensively scientifically argued, clearly and easily formulated and unambiguously, in a uniform interpretation applicable.
This implies ensuring the full reliability of indicators, the values of which are calculated and measured only on the basis of a sufficient volume and quality of primary data of accounting, reporting and other sources of information.
Along with the general requirements for each statistical indicator, specific requirements can be imposed.
There is an inseparable unity between the indicators of the plan and the statistics, since they: 1) reflect the quantitative side of the same specific socio-economic phenomena; 2) planned and statistical (reporting) indicators are calculated according to a single methodology, they are commensurate and comparable.
However, there are differences between the two:
1) the planned indicators are tasks for the further development of this object and are of a directive, legislative nature, and statistical indicators reflect the actually achieved level of development, the implementation of the plan;
2) statistical indicators in more detail characterize socio-economic phenomena, reflect the essential circumstances and important factors necessary for an objective analysis of the implementation of the plan. Therefore, the range of statistical indicators is much wider than the range of planned indicators, which makes it possible to analyze the factors that ensured the result of the plan, to identify internal reserves for improving production efficiency (for example, downtime, absenteeism, marriage are not planned at all, but may occur).
As a result of the summary and processing of statistical observation materials, generalizing statistical indicators are obtained. They can be expressed in absolute, relative and average values. Absolute values are obtained as a result of a summary of the material. On the basis of absolute values, average and relative indicators are calculated during data processing.
Absolute values are named values that express the size and volume of socio-economic phenomena within certain boundaries of place and time.
Generalizing absolute values are widely used in planning and management. With their help, the needs of society in various types of products, its actual output, the amount of necessary and available resources are reflected.
Statistical absolute values express the volumes or sizes of socio-economic phenomena within certain boundaries of time and place. For example, the population of the Republic of Belarus as of 1.01.2000 is 10019.5 thousand people. It can also characterize the result of processes for a certain period (profit from the sale of products in 1999 amounted to 444735 billion rubles).
Statistical absolute quantities are named numbers, they express the volumes of phenomena in certain units of measurement. Units of measurement can be natural, conditionally natural, labor and monetary (value).
Natural units of measurement express the number, measure of weight, volume, length (pcs., kg, m![]()
![]() . Natural units can be simple and composite (combined). For example, the production of fuel briquettes in 1999 in the Republic of Belarus is 1256 thousand tons. Some types of products can be taken into account in several different units of measurement. For example, liquid automobile fuel is taken into account in weight (in tons) and volume (in liters) units.
. Natural units can be simple and composite (combined). For example, the production of fuel briquettes in 1999 in the Republic of Belarus is 1256 thousand tons. Some types of products can be taken into account in several different units of measurement. For example, liquid automobile fuel is taken into account in weight (in tons) and volume (in liters) units.
The essence of accounting in conditionally in kind is that in order to obtain a total of production or consumption of several varieties of products designed to meet a specific need, they are recalculated by 1 product taken as a unit. For example, the total consumption of several types of fuel can be expressed in tons of equivalent fuel, taking into account the calorific value of different types of fuel.
Example. This year, the soap factory produced 15 tons of soap with 40% fat content, 20 tons with 50% and 25 tons with 70%. Soap with 40% fat content is taken as a unit. Therefore, for soap of 50% fat content, the conversion factor will be equal to (0.5:0.4) = 1.25 and for 70% – 1.75. Consequently, the total output of soap taking into account the conversion factor will be: (15 · 1) + (20 · 1.25) + (25 · 1.75) = 83.75 tons.
Labor units (man-hour, person-day, norm-hour) are used to determine the total costs of producing output or work. In labor units, the total volume of products produced by the brigade, the site, the workshop can be calculated. At the same time, the number of units of production of each type in physical terms is multiplied by the time norm established per unit of production and the resulting products are summed up.
Monetary (value) units of measurement (rubles, thousand rubles, million rubles) characterize the total volume of production, the amount of national income. To calculate the total volume of production, the volume of production is multiplied by the price of one unit of production (tariff). However, when characterizing the dynamics of the volume of production expressed in monetary terms, it must be borne in mind that over time, prices for individual types of products change, so the values become incomparable. In this case, the products of different periods must be calculated in the same comparable (constant) prices, i.e. in prices of the same period of time.
Absolute values are obtained either as a result of summation of statistical observation data, or by calculations. Thus, the total volume of electricity production for the year is obtained by summing up the reporting data for all power plants.
Many absolute values are determined by calculation. For example, the amount of profit is determined by subtracting from the amount of income of the enterprise its expenses and taxes. The balance method is widespread, in which the volume of the phenomenon at the end of the period is calculated, if the volume of the phenomenon at the beginning of the period and data on the magnitude of changes in the phenomenon for the period are known. For example, the balance of coal at the beginning of the month is 5 tons, for the month 45 tons were received from suppliers and 30 tons were spent on production. the Balance at the end of the month will be: 5 + 45 – 30 = 20 tons. For example, the absolute value of the machine-building plant’s demand for metal of a certain type can be calculated as the product of the planned volume of machine tool output by the average metal consumption per machine. V = 2500 pcs., m![]()
![]() = 46 kg. Therefore,
= 46 kg. Therefore, ![]() 46 · 2500 = 115000 = 115 tons.
46 · 2500 = 115000 = 115 tons.
The relative values calculated in the third stage of statistical research are the most important way to compare and analyze statistical data.
Relative value is the result of comparing 2 statistical indicators. According to the method of calculation, the relative value is a fraction. In this case, the numerator is called the compared value, and the denominator is the basis of the relative comparison. The base value can take different values. If the comparison base is taken as one, then the relative value is expressed by a number showing how many times one value is greater than another. This number is called the coefficient (electricity production in the Vitebsk region in 1999 was 15294 million kWh, and in 1998 – 14425 million kWh, therefore = ![]()
![]() 1.06). If the base number is taken as 100, then the relative value is expressed as a percentage (
1.06). If the base number is taken as 100, then the relative value is expressed as a percentage (![]() , therefore, the increase was 6%).
, therefore, the increase was 6%).
You can compare the same indicators relating to different periods, different objects, as well as different statistical indicators related to the same object (for example, output per capita). The relative value can also be a named number (prime or combined) of pieces, kg or t/km.
Relative values, depending on their cognitive essence, are divided into several types:
the relative value of the planned task; the relative value of the plan implementation; Relative magnitude of dynamics: relative magnitude of structure; the relative magnitude of the spatial comparison; The relative magnitude of the intensity.
The relative value of the planned task shows how many times or by what percentage the value of the indicator according to the plan with its value in the previous period should increase or decrease. For example, the actual level of annual labor productivity of one employee in 1998 was 16100.0 rubles; according to the plan of 1999 – 16600 rubles, therefore, according to the plan, labor productivity was planned to increase by 3.1% (16600 : 16100) · 100 = 103.1%. These relative values are usually expressed as a percentage. They are widespread. In this form, a planned task is given to increase labor productivity, reduce costs:
% pl.z. = 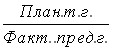 · 100.
The relative value of the plan implementation is the percentage ratio of the actual (reporting) value of the indicator to the planned value for the same period:
% of issue = ![]()
![]() .
.
For example, the volume of production output actually amounted to 131500 thousand rubles, and the plan provided for 130200 thousand rubles, therefore, % of the plan = ![]()
![]() .
.
If the plan was set in the form of a relative value, the change in the relative value compared to the previous period is calculated, then the resulting relative value is compared with the relative value of the planned task (for example, the plan provides for an increase in labor productivity by 3.4%, in fact, compared to the previous year, it increased by 5.2%, therefore, the overfulfillment of the plan was 1.7% (1.052: 1.034 = 1.017 = 101.7%).
When studying the production activities of enterprises, indicators are often used, the reduction of which means savings and (and) a positive impact on the work of enterprises (cost reduction, material costs per unit of production, downtime). In this case, in order to obtain a percentage of plan implementation, it is necessary to compare the size of the planned task with the actual value:
% of issue = ![]()
![]() .
.
According to the plan for 1999, the CHP was supposed to reduce the cost of energy production by 3%, but actually reduced it by 4%, therefore, the percentage of implementation of the plan (0.97: 0.96) · 100 = 101%.
To characterize the change in the phenomenon under study in time, relative values of dynamics are used. They are obtained by dividing the level of the phenomenon in a given period by the level of the phenomenon in the base period. They show how many times the volume of the phenomenon has increased (or decreased) and are called coefficients or growth rates. If there is data on the volume of the phenomenon for several periods, then the growth rate is calculated with a variable or constant comparison base:
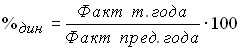 .
.
The relative value of dynamics with a variable comparison base is obtained by comparing the level of the phenomenon of each period with the level of the phenomenon from period to period (see Table 11) Kr![]()
![]() ; Kr
; Kr![]() ; Kr
; Kr![]() ; Kr
; Kr![]() .
.
A relative value with a constant comparison base is obtained by comparing the level of the phenomenon in each period with the level of one period taken as the base. The choice of comparison base is essential; as a basis for comparison, data for the period that is important for the development of the phenomenon under study should be taken (see Table 11):
Kr![]()
![]() ; Kr
; Kr![]() ;
;
Kr![]()
![]() ; Kr
; Kr![]()
There is the following relationship: ![]()
![]()
The relative values of the structure are calculated, as a rule, on the basis of structural grouping, they allow you to compare the compositions of aggregates of different volumes. The structure indicator is the relative share (or specific weight) of the part as a whole, expressed as a percentage:
 .
.
The relative values of the spatial comparison reflect the results of the comparison of the same indicators relating to different objects for the same period. With their help, a comparative assessment of the achievements of individual enterprises, economic regions, countries is given. For example, there are data on the volume of production in 1999 for two regions – Vitebsk and Brest. So, for the Vitebsk region – 15294 million rubles, and for the Brest region – 13961 million rubles A comparison of production volumes shows that in the Vitebsk region production is 1.095 times higher than in the Brest region.
Relative values of coordination are indicators that characterize the ratio of individual parts of the whole to each other. They are calculated by dividing one part of the whole into another part of the whole (9:1).
Relative values of intensity are obtained as a result of a comparison of different absolute values. They show the total of the numerator falling on 1, 10, 100, 1000, etc. units of the denominator. They are called relative values of the level of economic and social development. Among them, two groups are distinguished: the first includes indicators characterizing the degree of perfection of production, equipping its new equipment (power-to-weight labor – the amount of energy per one), the second includes indicators characterizing the degree of service to the population with various kinds of activities (providing the population with living space – the number of square meters of living space per 1 person; medical care – the number of doctors per 100 inhabitants, means of communication – the number of telephones per 1000 inhabitants). For example, the number of marriages in 1999 in Belarus is 73,000; number of divorces – 47000; total population in 1999 – 10 045 000 people, therefore, the number of marriages per 1000 people = (73000 : 10045000) · 1000 = 7,3; divorce rate per 1000 population = (47000 : 10045000) · 1000 = 4,7.