It was noted that the total population of Belarus has a tendency to decline. This process is the result of the historically formed conditions for the transformation of the socio-economic system, the disaster at the Chernobyl NPP. According to the census and censuses of the population, since 1897 its number has changed in waves from 6.7 million people (1897) to 9.0 million people (1940) and 9.9 million people (2002), Table. 5.1.
Table 5.1 Resource requirements by component
Population dynamics of Belarus (at the beginning of the year)
Years | The entire population, thousand people. | In total population, % | |
Urban | Rural | ||
1897* | 6673,0 | 13,5 | 86,5 |
1913 | 6899,1 | 14,3 | 85,7 |
1940 | 9046,1 | 21,3 | 78,7 |
1951 | 7781,1 | 22,2 | 77,8 |
1959* | 8055,7 | 30,8 | 69,2 |
1970* | 8992,2 | 43,3 | 56,7 |
1979* | 9532,5 | 54,9 | 45,1 |
1989* | 10151,8 | 65,4 | 34,6 |
1995 | 10210,4 | 67,9 | 32,1 |
1999* | 10045,2 | 69,3 | 30,7 |
2000 | 10019,5 | 69,7 | 30,3 |
2001 | 9990,4 | 70,2 | 29,8 |
2002 | 9950,0 | 70,7 | 29,3 |
2003 | 9898,6 | 71,1 | 28,9 |
2004 | 9849,1 | 71,5 | 28,5 |
*According to population censuses
During the period from 1897 to 1940, the population increased by about 2.2 million people. this period accounted for the First World War and the Civil War, the beginning of socialist transformations, industrialization, the reunification of the western and eastern parts of the country. However, the republic remained an agrarian country, so the urban population remained low.
Between 1951 and 1994, the population grew from 7.8 million to 10.3 million. It was a period of industrial transformation and the beginning of market reforms. The republic turned into an industrial-agrarian country, the urban population increased dramatically. But the disaster at the Chernobyl nuclear power plant, as well as the consequences of the Great Patriotic War and inadequate social policy, marked the beginning of a demographic decline. As a result, between 1995 and 2003, the population decreased by 360,000 and continues to decline. The ratio between men and women has remained stable over the past 20 years (47% of the male population and 53% of the female population).
Estimates taking into account demographic waves since 1960 show that by 2020 the total number may decrease by 1-1.5 million people compared to 2000, Fig. 5.1.
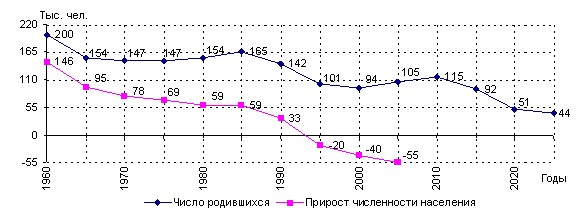
Rice. 5.1. “Demographic Waves” of Population Change
of births and population growth of Belarus
(indicative assessment)
In the last decade, natural growth has been the basis for the growth of the population of Belarus. Since 1970, the demographic development of the republic has been characterized by a rather unfavorable trend of a steady decline in natural population growth (Table 5.2). Fertility rates after a sharp decline in the 50-60s, the relative stability of the 70s and the growth of the 80s. began to decline sharply in the 90s. 5.2.
Table 5.2 Resource requirements by component
Number and natural increase of population of Belarus
Index | 1959 | 1970 | 1979 | 1989 | 1999 | 2001 | 2002 |
Population, thousand people | 8055,7 | 8992,2 | 9532,5 | 10151,8 | 10045,2 | 9940,4 | 9899 |
Born, thousand people. | 200,2 | 146,7 | 154,4 | 153,5 | 93,0 | 91,7 | 89 |
Died, thousand people. | 54,0 | 69,0 | 95,5 | 103,5 | 142,0 | 139,9 | 149 |
Natural increase, decrease (-), thousand people. | 146,2 | 77,7 | 58,9 | 50,0 | -49,0 | -48,2 | -59 |
Number of births per 1 thousand people, people. | 25,2 | 16,2 | 15,8 | 15,0 | 9,3 | 9,2 | 8,9 |
The number of deaths per 1 thousand people, people. | 7,7 | 7,6 | 9,5 | 10,1 | 14,2 | 14,0 | 14,9 |
Natural increase, decrease (-) per 1 thousand people, people. | 17,5 | 8,6 | 6,3 | 4,9 | -4,9 | -4,8 | -5,9 |
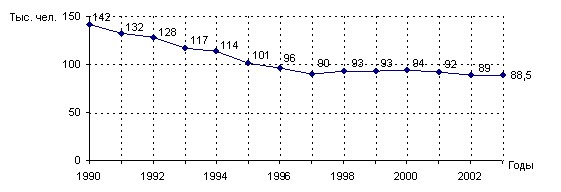
Rice. 5.2. Dynamics of the number of births in Belarus in 1990-2003
Scientists believe that the current decline in the birth rate by 1/3 is due to the demographic structure of the previous 20 years and by 2/3 – socio-economic and demographic factors of the 90s. [7, p.27].
The decline in the birth rate is a process characteristic of many developed Western European countries. It is explained, in particular, by the increase in the level of education of women, Fig. 5.3.
Sex and age structure of the population. The main trend in the evolution of the age structure of the population is its aging. If the share of people older than working age in 1960 was 13.6%, in 1980 – 16.9%, then at the beginning of 2000 – 21.5%. And as a result, every fifth resident of the republic is of retirement age. The number of people in this category is almost equal to the number of children under the age of 16. Note that in 1960 the number of children was 2.3 times higher than the number of people older than working age. The main reason is a sharp decline in the number of births, as a result of which the proportion of children in the total population has decreased. So, if in 1960 the share of the population in the pre-working age was 31.9%, then in 2001 – 21.8%. The ageing process has affected both urban and rural populations. Between these groups, there are large differences in age structure. In 2001, the share of residents of retirement age in the cities of the republic was 16.2%, in rural areas – 33.7%. Thus, every third rural resident is a pensioner. In urban areas, the share of people of working age is 61.3% of the population, in rural areas – 45.4%. This led to an increase in the burden on the able-bodied population. Today in Belarus there are 765 people of incapacitated age per 1000 people of working age (in the city 627 people, and in rural areas – 1193 people).
A sharp increase in the population at retirement age requires a significant increase in spending on pensions, medical care, and the organization of social protection.
Significant violations in the structure of the population of Belarus by sex (a decrease in the proportion of men) began during the Great Patriotic War. And although by the 70s. they have mostly smoothed out, but they make themselves felt in the age group over 70 years.
Over the past five years, mortality has increased the most in men, and in the young working age. Among the main classes of causes of mortality, diseases of the circulatory system predominate, Table. 5.3.
Table 5.3 Resource requirements by component
Mortality by major classes of causes
(people per 100 thousand people) in Belarus in 1990 and 2002.
Years | Neoplasms | Diseases of the circulatory system | Accidents | Respiratory diseases |
among the urban population | ||||
1990 | 150 | 359 | 85 | 35 |
2002 | 175 | 578 | 143 | 37 |
among the rural population | ||||
1990 | 220 | 919 | 131 | 149 |
2002 | 243 | 1332 | 243 | 129 |
Findings:
Mortality from almost all causes is increasing in both urban and rural areas. Mortality in rural areas is 1.5 times higher than mortality in urban areas. The main cause of death is diseases of the circulatory system (more than 60%). Mortality from diseases of the circulatory system and respiratory organs in rural areas is 2-4 times higher than in the city. This suggests that the level of health care and the general cultural level of the population are lower in rural areas.
At the age of over 70 years (both in urban and rural areas), men are 2.6 times less than women. This is partly due to the fact that women have a greater ability to overcome life’s difficulties, so they are less prone to suicide, Table. 5.4.
In recent years, in Belarus, as in most countries of the world, the number of marriages not registered by the registry office is increasing, and the number of divorces is also growing rapidly. So, if in 1970 there were 1.9 divorces per 1000 people of the population, then in 1980 – 3.2; in 2000 – 4.3.
Table 5.4 Resource requirements by component
Deaths from suicide (per 100,000 population)
of the corresponding sex and age) in Belarus in 1990-2002.
1990 | 1995 | 2002 | ||||
men | women | men | women | men | women | |
Altogether | 34,5 | 8,0 | 56,4 | 9,5 | 60 | 9,7 |
Of these in age (years): | ||||||
40-49 | 63,1 | 10,7 | 96,6 | 13,9 | 87,8 | 12,3 |
50-59 | 62,2 | 13,6 | 116,2 | 19,3 | 99 | 16 |
70 and more | 45,6 | 17,6 | 69,5 | 17,7 | 77,5 | 17,6 |
Findings:
Female suicidality is 4-6 times lower than that of men, which indicates a greater ability of women to adapt to living conditions. Men are more acutely responsive to changing socio-economic conditions. In the crisis of 1995, the level of suicidality increased sharply, but in the subsequent period it did not decrease, despite the stabilization in society.
The average composition of the family also decreased. If in 1969 it was 3.7 people, then in 2001 less than three people. the share of small families that consisted of 2-4 people increased, the proportion of large ones – of 5 or more people decreased. The most common in Belarus is a family that consists of one married couple and one child or no children (a simple, puclair family). They account for 73% of all families. The proportion of single-parent families is growing (children remain with one of the parents). There are approximately 13.5 per cent of such families. The main reason is the difficult economic situation. Today, working mothers and fathers, who receive the average wage in the national economy, cannot provide normal conditions for the growth and development of two children in a family. A significant proportion of families (70%) live below the poverty line.
Life expectancy at birth is one of the most important integral indicators that characterizes not only the quality of life in the country, but also a set of behavioral factors associated with human development. This indicator in Belarus for almost the entire XX century. had a tendency of rapid growth: it grew from 38 years in 1897 to 72.9 years in 1968-1969 In the second half of the 70s – early 80s. this indicator stabilized, and then it was noted a decrease to 70.8 years in 1983-1984. in 1986-1987. there was a short-term increase in life expectancy (up to 72.0 years), and since the 90s. began a steady decline. Thus, in 1990, the total life expectancy was 71.1 years, in
2002 – 68.0 (women – 75 years old and 61 years old men). For comparison, we note that the average life expectancy in Japan is 79.8 years (for men – 76.4, for women – 82.9); in Sweden –
78.3 years (76.5 and 81.5 respectively); in Canada – 78.2 years
(74.8 and 81.0, respectively). Thus, life expectancy in Belarus in comparison with the above countries of the world is lower among men by 12-14 years, among women – by 7-9 years, whereas in the mid-60s it was close to the level of European countries. Today, the republic in terms of this indicator occupies one of the last places among the first 100 countries of the world. The main reason is the steadily growing mortality of the population at all ages. Particularly alarming is the rapid increase in the mortality of both men and women of working age, as well as children.
Population migration. Intra-republican migration flows remain quite high: about 200.0 thousand people move annually within Belarus. The urban population due to the migration flows of the rural population of the republic increases by about 30 thousand people per year A significant impact on internal migration was exerted by the aggravation of the environmental situation after the Chernobyl disaster. More than 130,000 people were relocated from the contaminated areas. A feature of this migration flow is that immigrants who have left their place of residence are now returning back to contaminated areas.
External migration flows have also changed dramatically in recent decades. So, if in the 50-60s Belarus lost its population due to the outflow to Russia (new buildings in the Far East, Siberia, etc.), to the Baltic countries, to Kazakhstan (development of virgin and fallow lands), then in the 80s the migration balance became zero.
In external migration, two streams can be distinguished: the first – with the CIS and Baltic countries, and the second – with other states. In the first stream, Belarus during the 90s. had a constant positive net increase, in the second – constantly negative. For 8 years (1991-1998), the largest amount of net migration growth was noted from Russia (81.7 thousand people) and the Baltic countries (41.8 thousand people). A significant influx also took place from Kazakhstan (24.6 thousand people), Ukraine (24.5 thousand people), from the countries of Central Asia (19.0 thousand people), the countries of Transcaucasia.
(15.6 thousand people). There is also a re-emigration of ethnic Belarusians: among registered immigrants, representatives of the titular Belarusian nationality accounted for 40-50%. Thus, in 1990-1997 alone, 236.8 thousand people of Belarusian nationality arrived in Belarus from the CIS and Baltic countries. This is more than 10% of all Belarusians who lived in the territory of the former USSR outside Belarus. The maximum influx of population to Belarus from almost all the former republics of the USSR occurred in 1992. As before, the main migration inflow of Belarus comes from Russia, Ukraine and Kazakhstan: 90% of those who arrived in the republic are citizens of these states.
(Table 5.5).
A sharp deterioration in the socio-economic, environmental situation in the republic, the liberalization of life in the country, significantly increased in the late 80s – early 90s. the outflow of the population from the republic. In 1989, 14.7 thousand people received permission to leave for other countries, in 1990 this number doubled. In subsequent years, this flow decreased, and then stabilized at about 9 thousand people. per year. In the late 80s – early 90s, israel was the state of traditional emigration. Then the flow to Israel decreased several times. There was a slow but rather steady increase in the share of emigrants to Germany. The flow of emigrants to other countries of the world, especially to Asian countries, has increased. In the 90s. there were changes in migration processes, which gave rise to new problems for Belarus.
Table 5.5 Resource requirements by component
The main external migration flows of Belarus, people.
1990 | 2003 | |||||
Number of arrivals | Number of departures | Migration increase, decrease (–) | Number of arrivals | Number of departures | Migration increase, decrease (–) | |
Migration with foreign countries | ||||||
116062 | 135625 | –19563 | 18146 | 12986 | 5160 | |
Including: with cis and Baltic countries: | ||||||
99310 | 105916 | –6606 | 16629 | 8348 | 8281 | |
Russia | 59836 | 73149 | –13313 | 9406 | 6709 | 2697 |
Moldova | 950 | 862 | 88 | 331 | 43 | 288 |
Ukraine | 17399 | 21762 | –4363 | 3098 | 1048 | 2050 |
Azerbaijan | 2872 | 843 | 1939 | 207 | 15 | 192 |
Armenia | 1026 | 301 | 725 | 218 | 13 | 205 |
Georgia | 964 | 521 | 443 | 126 | 15 | 111 |
Kazakhstan | 4507 | 2914 | 1593 | 1735 | 178 | 1557 |
Tajikistan | 1048 | 280 | 768 | 96 | 6 | 90 |
Turkmenistan | 593 | 392 | 201 | 128 | 118 | 10 |
Uzbekistan | 2030 | 1511 | 519 | 417 | 24 | 393 |
Latvia | 2903 | 1345 | 1558 | 242 | 34 | 208 |
Lithuania | 3987 | 1461 | 2526 | 416 | 121 | 295 |
Estonia | 765 | 283 | 482 | 43 | 16 | 27 |
With other states | ||||||
16752 | 29709 | –12957 | 1517 | 4638 | –3121 | |
2000s | 2001 | |||||
UNITED STATES | 62 | 1560 | –1498 | 70 | 1318 | –1248 |
Germany | 57 | 918 | –861 | 47 | 1306 | –1259 |
Israel | 198 | 2500 | –2302 | 207 | 1701 | –1494 |
Poland | 42 | 81 | –39 | 51 | 83 | –32 |
These include, first of all, the problems of the growth of illegal (illegal) migration, forced and world labor migration. According to experts, from 100 to 300 thousand people who came from the CIS countries, Asia, Africa, the Near and Middle East are in an illegal situation in Belarus.
World labor migration also has a special dynamics. According to the Ministry of Statistics and Analysis of the Republic of Belarus, in 1995 there were 225 registered specialists who came to the republic and 1692 left it. In subsequent years, the number of specialists who left increased tenfold. There is also unregistered world labor migration in the republic, the volume of which is growing all the time. The lack of a strict system of regulation of the inflow and outflow of labor in Belarus causes the spontaneous nature of its integration into the world labor market, which, in turn, leads to serious negative results.
Thus, taking into account the current demographic situation in Belarus based on the demographic forecast, it can be concluded that during 2000-2015 the development of the demographic situation will remain negative. There will be a further slowdown in population growth, as the causes of low fertility and high mortality are persistent, fig. 5.4, 5.5.
It can be assumed that if the migration policy does not change, then even a simple reproduction of the population will not be ensured in the republic and the process of depopulation will continue. By 2015, the number of children will be reduced by almost one third, and their share will be 15%. The dynamics of the working-age population will be ambiguous. Thus, in comparison with 2000, in which its share was 58.5%, there will first be an increase (2005 – 62.0%, 2010 – 62.7%), and then its decrease (2015 – 60.7%). The number of people older than working age will also increase: if in 2000 its share was 21.2%, then in 2015 it will be 24.3%.
Summing up, we can note the following features of the demographic situation in the Republic of Belarus:
Low birth rate – 8.9 ppm (in European countries – 9-11) and high, not typical for developed countries, mortality of the population (respectively 14.6 and 10-11 ppm).
As a result, the natural population decline (-5.6 ppm) is much higher than in Western European countries (0.1-0.7 ppm); Deformation of the composition of the population by sex due to the high mortality rate of men of working age and the migration of young women from rural areas; The composition of the population is too “elderly” (according to UN standards, the share of people aged 75 years and older is normal within 7%, in the Republic of Belarus they are more than 13%). In 2003, the proportion of persons over working age was 21.2 per cent. Unlike economically developed countries, where this process is caused by an increase in life expectancy, in Belarus the main factors of aging are the decrease in the proportion of children in the total population due to a decrease in the birth rate and an increase in mortality, especially for men of working age; The growth of the working-age population at the expense of persons aged 40 years and older, which creates the prerequisites for a decrease in the number of this category in the near future; Increasing the proportion of young people in rural areas due to increased mortality of older people; Growth in the number and proportion of the able-bodied population until 2006; Reducing the demographic burden to
2010 (the proportion of persons aged 75 years or more per 1000 people of the working-age population from 721 (2000) to 592 (2010)). Note that in other countries this indicator has a lower value (Poland – 650; USA – 540; Japan – 440); The decline in the proportion and number of children under 16 years of age will intensify the aging process of the population. In 2006-2010, the age structure of the population is expected to deteriorate further. According to the forecast, the share of children and adolescents in the total population will decrease from 16.9% to 15.0%, and the share of older persons will increase from 21.0 to 21.9%. There will be a tendency to reduce the number of people of working age.
Currently, the demographic situation provides the economy with labor resources, but the expanded reproduction of the population is not provided, Table. 5.6. In a few years, the number of labor resources will also decrease.
Table 5.6 Resource requirements by component
Distribution of the population of Belarus into groups relative to the working age in 1995 – 2004 (at the beginning of the year), million people.
Population by groups | Years | ||
1995 | 2002 | 2004 | |
Population | |||
younger than working age | 2,4 | 1,8 | 1,76 |
of working age | 5,7 | 5,97 | 6,0 |
older than working age | 2,1 | 2,1 | 2,1 |
Findings:
The number of people younger than working age in 2002 compared to 1995 decreased by 25%, which in the near future will lead to a decrease in the number of the working-age population. The working-age population increased by 4.7% in 2002 compared to 1995, but in the future this group will increase the number of pensioners (if the retirement age is not increased). The number of people older than working age did not change during the period under review with a decrease in the total population. Number of pensioners at a future age.
To overcome unfavorable trends, the main goal of demographic development should be to strengthen the health and reduce the mortality of the population, especially men of working age. Particular attention should be paid to the creation of favorable conditions for the life of the family, ensuring the possibility of the birth and upbringing of several children.
In order to regulate internal migration, measures are envisaged aimed at developing economic levers of influence on the migration behavior of the population, contributing to replacing its natural decline and reducing the outflow of specialists from rural areas. In the field of foreign migration, the state’s policy should be focused on improving migration legislation and fulfilling the obligations assumed by the Republic of Belarus within the framework of relevant international treaties and agreements.
In 2011-2020, a decrease in the rate of population decline, a decrease in the number of children and the working-age population with an increase in persons older than working age is projected.
The demographic policy during this period will be aimed at ensuring the regime of reproduction of the population close to economically developed countries, characterized by consciously controlled fertility, decreasing mortality and increasing life expectancy.
To regulate external migration, it is necessary to implement measures that contribute to reducing migration outflow and preserving the intellectual potential of the country. Priorities in internal migration will be measures to increase the territorial mobility of labor and create living conditions for the population, taking into account the needs of the socio-economic development of the country’s regions.
It is clear that if we maintain production on a real scale and even more so expand it, then labor immigration cannot be dispensed with (there are examples of Moscow and developed countries).