Indices are the most important type of generalizing statistical indicators. They are used to characterize the dynamics of phenomena, comparisons in various territories, in the control and development of planned tasks. Along with average values, they represent one of the most common types of statistical indicators. The word “index” in Latin means index, indicator. In statistics, this term has a specific meaning. An index is a relative value that characterizes the change in complex social phenomena in time, space or in comparison with the plan.
The index is the result of a comparison of two eponymous quantities, so it is necessary to distinguish between the value of the comparison (the numerator of the index ratio) and the comparison base (denominator). The choice of the comparison base is determined by the purpose of the study; when studying the dynamics, data from a previous period are used as a base; when monitoring the implementation of the plan – planned data; in case of territorial comparisons – data from another territory.
The value of the comparison is usually called the indicator of the reporting period, the comparison base is called the indicator of the base period. If the base level is taken as one when calculating the index, then the indices are calculated as coefficients, and if the base level is taken as 100, then the index is calculated as a percentage. Based on the calculation, it is possible to determine how many times the reported value is greater or less than the base value, or by what percentage it is more or less than the base value.
Statistics studies mainly complex economic phenomena that consist of elements that are directly incommensurable. So, if an electromechanical plant produces several types of products, then data on output in physical terms cannot be summed up. In order to show the total change in output for several types of products, indices are calculated. With their help, it is possible to give a generalized description of changes in cost, prices, output for several types of products.
With all their diversity, economic indices are divided into individual and general indices.
An individual is an index that characterizes the change in the volume of production, sales volume, level of labor productivity, etc. in relation to any one product. For example, there are the following data on the production of alternating current electric motors with a height of the axis of rotation of 63-450 mm (thousand pieces) 1998 – 448; 1999 – 188. Let’s determine the individual index of the physical volume of production:
 ;
; ![]() , i.e. there was a decrease in production by 58%.
, i.e. there was a decrease in production by 58%.
Individual indices:
prices 
 ; cost ; cost .
General (aggregate) is an index that characterizes the total (average) change in the volume of production, sales volume, price levels, etc. in relation to a set of series of goods. For example, indices showing the change in the total volume of production of various types of products or the change in the price level of various types of goods as a whole. When calculating general indices, there are problems of measuring indicators for individual goods. The commensurability of individual indicators is achieved by weighting, the essence of which is that when calculating, they abstract from the influence of changes in one of the sides of the phenomenon under study, taking it as an unchanging value. Thus, when calculating the index of the volume of products sold, prices will be unchanged values, and when calculating the price index, the number of products sold. That side of the phenomenon under study, from the influence of which changes are abstracted, taking it for unchanging, is called index weights.
The indices of volume indicators include indices of the physical volume of production, the number of workers, the total consumption of materials. They measure the total, total volume of a particular phenomenon.
Methods of constructing indices of volume indicators will be considered on the example of the index of the physical volume of production. When calculating it, the task is to characterize the change in the volume of all products manufactured by an enterprise or a group of enterprises.
Individual indices of the physical volume of production characterize the change in output for each type of product, their formula can be written as follows:
 ,
,
where ![]()
![]() and
and ![]() is the output of products of this type in the reporting and base period, respectively.
is the output of products of this type in the reporting and base period, respectively.
In essence, these indices do not differ from relative values and represent the ratio of the quantity of products of the reporting period to the number of products of the base period.
To obtain a generalized characteristic of the dynamics for the entire totality of products, the aggregate (general) index of the physical volume of production is calculated.
To ensure that the index reflects only the change in the volume index, the weights in its numerator and denominator are fixed at the level of the same period. In this case, in order to show the change in the volume of production, it is necessary to eliminate the change in prices. This is achieved by the fact that the products of the reporting and base period are calculated in the same (fixed) prices.
General index of physical volume of production:
 ,
,
where ![]()
![]() is the indexed value;
is the indexed value;
![]()
![]() – weight;
– weight;
![]()
![]() – prices are comparable (basic).
– prices are comparable (basic).
Quality indices include price indices, production cost indices, average wage indices, labor productivity indices, and specific material consumption indices. These indices characterize indicators that are of a calculated nature. They measure the intensity, effectiveness of the phenomenon and are either average or relative values.
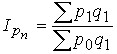
Consider the calculation of the individual and general index of qualitative indicators on the example of the price index.
The individual price index characterizes the price change for each type of product:
 ,
,
where ![]()
![]() and
and ![]() – respectively, the price of the reporting and base period.
– respectively, the price of the reporting and base period.
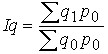
The general (aggregate) index of the qualitative indicator is tasked with measuring not only the relative change in the level, but also the absolute value of the economic effect that is obtained in the current period as a result of this change. In this case, the amount of savings of buyers due to lower prices, or the amount of their additional costs, if prices have increased.
To obtain a general price index, it is necessary to construct it in such a way that the influence of only the factor of price changes is reflected, and the influence of changes in the number of goods sold would be excluded. This is possible if the same number of goods sold is taken for both comparable periods. The number of goods sold should be taken in the current period, since only on the acquisition of this quantity the consumer can save as a result of lower prices or overspend as a result of their increase.
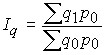
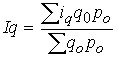
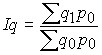
General price index:
 – Paasche price index,
where ![]()
![]() is the indexed value;
is the indexed value;
![]()
![]() – weights.
– weights.
The index numerator gives the total value of goods sold in the current period at the prices of the current period, and in the denominator – the value of the same number of goods, but calculated at the prices of the base period.
Savings (overspending) from price changes:
![]()
![]() .
.
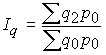
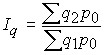
In statistics, other forms of representation of general price indices – Laspeyres and Fisher – are also used:
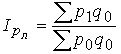 – Laspeyres price index,
![]()
![]() – Fisher price index.
– Fisher price index.
If there are three or more periods when calculating the indices of the compared periods, then the question arises about the choice of the comparison base. Depending on the basis of comparison, chain and base indices are distinguished.
Chain indices are obtained by comparing the indexed indicator of any period with the indicator of the period preceding it. Basic indices are calculated by comparing the indexed indicator of each period with the corresponding indicator of the period taken as the comparison base.
Chain and base indices can be both individual and general.
There is a certain relationship between chain and base indices, which is always manifested for individual indices, and only under certain conditions for aggregate indices.
Basic individual indices:
 ;
;  ;
;  .
.
Chain individual index:
 ;
;  ;
;  .
.
Sequential multiplication of chain individual indices makes it possible to obtain a basic index:
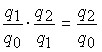 .
.
Basic aggregate index of the physical volume of production:
 ;
;  .
.
Chain aggregate index of the physical volume of production:
 ;
;  .
.
Sequentially multiplying the chain aggregate indices of the physical volume of production makes it possible to obtain the basic index:
 .
.
Aggregate indices of qualitative indicators are always indices with variable weights, since the weights of the reporting period are always used in their calculation. Therefore, the chain method of calculating the basic indices is not acceptable for them.
The aggregate method of calculating the general indices is the main, but not the only one in statistics. In some cases, due to the lack of some data, it is not possible to calculate using the aggregate index formula. This may be the case if there is no data on the absolute value of the indexed value, i.e. the value of the indicator characterizing the side of the phenomenon whose change is being studied (for example, when calculating the index of the physical volume of production, there is no data on the volume of production as a whole). In this case, the average indexes are applied.
Table 24 Resource requirements by component
Chain and base indices
Indices | Basic | Chain | |
physical volume of production |
|
|
|
|
|
| |
Prices |
|
|
|
|
|
| |
Cost |
|
|
|
|
|
|

 ;
;  ;
;
 ;
;  ;
;
 ;
; 

 ;
; 

 ;
; 

 ;
; 
We know that the individual volume index is expressed  by , therefore,
 ![]() if in the formula of the aggregate index
if in the formula of the aggregate index  we replace
 ![]() with the expression
with the expression ![]() , then we get the formula of the average arithmetic index of physical volume:
, then we get the formula of the average arithmetic index of physical volume:
![]()
![]()
Example:
Table 25 Resource requirements
Name Product | Change in sales volume in the reporting period compared to the base period, % | Turnover in the base period, million rubles. |
Potato | +25 | 120 |
Cabbage | +75 | 60 |
Milk | no change | 150 |
Determine the overall index of the physical volume of production.
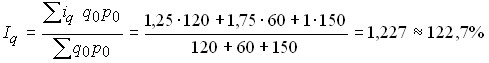 (output increased by 22.7%).
In cases where there are no data on the number of goods sold, it is not possible to calculate the aggregate price index, but if individual price indices are known, and there are also data on sales in the current period in the prices of the current period, thus it is possible to calculate the average harmonic price index.
From the formula of the individual price  index, we determine
  . If in the aggregate price
 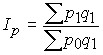 index we replace in the
 ![]() denominator
denominator ![]() with , then we get the formula of the average harmonic price index:
with , then we get the formula of the average harmonic price index:
 .
.
Example:
Table 26 Resource requirements
Product Name | Price change in the reporting period compared to the base period, % | Turnover in the current period, million rubles. |
Potato | -25 | 112,5 |
Cabbage | -17 | 87,5 |
Milk | +17 | 175,0 |
Determine the general price index:
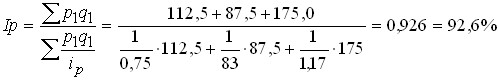 (prices are reduced by 7.4%).
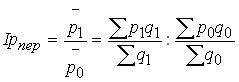
A change in the structure of the studied population affects the dynamics of economic phenomena. Consider this provision on the example of changes in prices in all markets for a single product. Price changes can be the result of two factors: changes in the price level in individual markets and changes in the ratio of the quantity of a given product sold in individual markets with different price levels for this product.
First, let’s determine the result of the joint action of both factors. In this case, the price index for some commodity is defined as the ratio of the average price of the current period to the average price of the base period. To determine the average prices of the current and base period, the quantity of goods sold in the relevant periods is taken as weights:
 .
.
The ratio of two weighted averages with changing (variable) weights, showing the change in the indexed value, is usually called an index of variable composition.
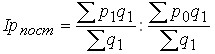
To determine the change in the price level in its pure form, it is necessary to eliminate the impact of a change in the sales structure:
 .
.
The ratio of weighted averages with the same weights is called the index of constant (fixed) composition.
To determine the impact of changes in the ratio of the quantity of goods sold in different markets, it is necessary to eliminate the impact of price changes in individual markets, i.e. fix them at the basic level. For these purposes, an index of structural shifts is calculated:
 ,
,
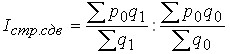 .
.
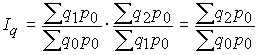
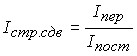
All economic phenomena are interrelated with each other. Thus, the cost of produced products depends on the amount of output produced and the price per unit of production. Also related are the indices that characterize the changes in this phenomenon:
![]()
![]() .
.
 ;
;  .
.
Multiply these indexes:
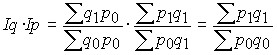 . Hence, .
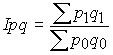
On the basis of two indices, with the unity of the methodology for their construction, the third can be calculated. So, if the volume of production increased by 10%, and the price decreased by 5%, then the change in value will be: 1.1 · 0.95 = 1.157 or 115.7%.
The index method is widely used in the analysis of the role of individual factors in the dynamics of a complex phenomenon. At the same time, the index method allows you to determine the size of the absolute change in a complex phenomenon due to each factor separately.
A complex phenomenon should be considered such an indicator, which can be represented as the product of two or more indicators. Suppose that complex phenomenon A is the product of two indicators: a and b, i.e. A = a · b.or ![]()
![]() . The change in a complex phenomenon can be represented by an index.
. The change in a complex phenomenon can be represented by an index.
 or .
or . 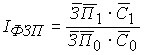
The absolute change in the phenomenon under the influence of all factors represents the difference between the numerator and the denominator:
![]()
![]() or .
or . ![]()
The challenge is to identify the influence of each factor individually. To do this, the index of a complex phenomenon is decomposed into particular indices that characterize the role of each factor.
The essence of the method of separate study of factors lies in the fact that when identifying the role of each factor, a complex phenomenon in the reporting period is taken in the form that it would have if one given factor had changed, and the others remained unchanged (at the level of the base period).
The role of each factor will be determined by:
 or ,
or , 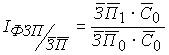
Absolute deviation:
![]()
![]() or
or ![]()
 or ,
or , 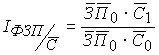
Absolute deviation:
![]()
![]() or
or ![]() .
.
The general change in phenomenon A can be represented as the product of particular indices.
![]()
![]() ,
, ![]() or .
or . ![]()
As a result of summing the absolute deviations, an indecomposable residue is obtained, which can be considered as the result of the joint action of all factors.
In the sequential-chain method, a system of interrelated private indices is used. With this method, identifying the influence of the qualitative factor, the volumetric factor in the construction of the index is kept at the level of the reporting period; when constructing the volume factor index, the qualitative factor is taken at the level of the base period.
If a ![]()
![]() is the qualitative factor, b
is the qualitative factor, b ![]() is the volume factor:
is the volume factor:
 ; absolute deviation
 ![]()
 ; absolute deviation
 ![]()
![]()
In this case ![]()
![]() , .
, .