Let an enterprise (for example, a furniture factory) produce tables and chairs. The consumption of resources for their production and the profit from their sale are presented below:
TABLES | CHAIRS | VOLUME RESOURCES | |
Consumption of wood per product, m3 | 0,5 | 0,04 | 200 |
Labor consumption, person-hour | 12 | 0,6 | 1800 |
Profit from sales units of the product, rub. | 180 | 20 |
In addition, a contract has been signed with the municipality for the production of 80 tables, which, of course, must be fulfilled. It is necessary to find such an optimal production program so that the profit from the sale of products is maximum.
Let x1 be the number of tables;
x2 is the number of chairs.
Then the constraint system and the objective function will be written as follows:
180×1 + 20×2 max (objective function);
0.5×1 + 0.04×2 ![]()
![]() 200 (wood restrictions);
200 (wood restrictions);
12×1 + 0.6×2 ![]()
![]() 1800 (labor restrictions);
1800 (labor restrictions);
x180![]()
![]() (contract with the municipality);
(contract with the municipality);
x1 ![]()
![]() 0; x2
0; x2![]() 0;
0;
x1, x2 are integers.
To solve the problem in Excel, write it down in the form presented in Fig. 3.4.

Rice. 3.4. Recording the initial data for solving the linear optimization problem
To solve the problem, call the Tools-Solver menu.
In the Find a Solution dialog box that opens, see How to: Find a Solution Dialog Box. 3.5.) specify:
the address of the target cell (in our example, D5);
The range of cells to look for (A2:A3)
Restrictions: А2>=80
A2:A3=Integer
A2:A3>=0
B2<=D2
B3<=D3 .
Additions, changes and deletions of restrictions are made using the Add, Change, Delete buttons.
To find the optimal solution, click the Solve button. As a result, in the table we get the value of the objective function – 42400 million rubles. at x1 = 80 and x2 = 1400.
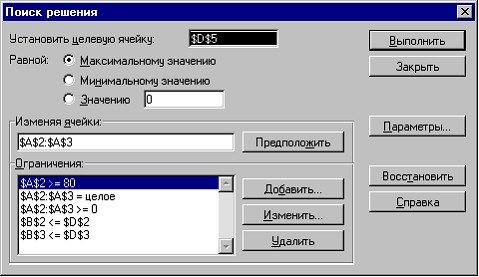
Rice. 3.5. Find a Solution Dialog Box
The Solver Results dialog box allows you to use the Solution Results dialog box. 3.6.):
Save the found optimal solution on the current worksheet. Restore the original values. Save the script. issue reports on the results, sustainability, limits necessary for the analysis of the solution found.
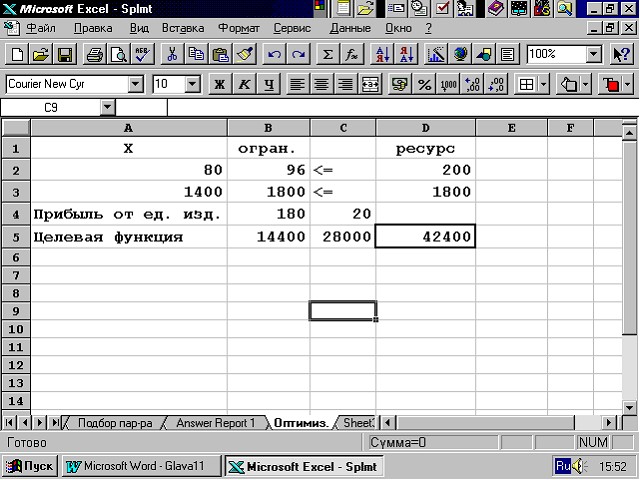
Fig.3.6. Worksheet with the found optimal solution
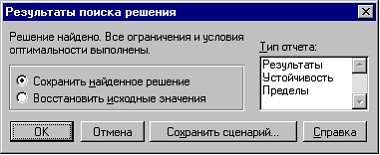
Rice. 3.7. Solution Results Dialog Box
If you click on the OK button, then in place of the original table we get a table with the found optimal values (see Figure 3.7).
As can be seen from the results of the decision, it is not very profitable for the company to produce tables. Therefore, it limited the volume of their release in the amount necessary to fulfill the contract. The rest of the resources are directed to the production of chairs.