Evaluation of effectiveness should be carried out based on the interests of all its participants: a foreign investor, an enterprise and local and republican authorities. According to methodological recommendations, the following types of economic efficiency are distinguished:
commercial (financial) efficiency, taking into account the financial results of the project for its direct participants; budget efficiency, reflecting the financial consequences of the project for the republican and local budgets; economic efficiency reflects the impact of the investment project implementation process on the external environment for the project and takes into account the ratio of results and costs of the investment project, which are not directly related to the financial interests of the project participants and can be quantified.
The methodology for calculating the effectiveness of project implementation consists of four stages:
1. Estimation and analysis of total investment costs. It involves the calculation of the needs in the main and working capital, the distribution of financing needs by stages of the investment cycle (design, construction, installation, commissioning, access to the design capacity, work at full capacity);
2. Estimation and analysis of current costs. This includes the preparation of an estimate of the costs of production of products (works, services), the definition and analysis of the cost of certain types of products (works, services).
3. Calculation and analysis of indicators of commercial efficiency of the project.
4. Definition of indicators of budget efficiency.
The main problem in the calculation of indicators is to bring different investment costs and future revenues into a comparable form, i.e. to the initial period.
The assessment of future costs and results is carried out within the calculation period, the duration of which (the calculation horizon) is taken taking into account the weighted average normative service life of the main technological equipment or the requirements of the investor.
To give different time indicators, the discount coefficient (?t) is used, determined by the formula:
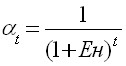 ,
,
where t is the year whose costs and results are brought to the initial period (t = 0,1,2,…,T);
Yen is a discount rate equal to the acceptable rate of return on capital for an investor.
The purpose of the Yen coefficient is to temporarily order the money of different time periods. Its economic sense: what annual percentage of return does the investor want or can have on the capital he invests. Setting it, they usually proceed from the level of inflation and the so-called safe or guaranteed level of profitability of financial investments, which is provided by the state bank in transactions with securities. An important point in determining the discount rate is risk consideration. Risk in the investment process appears in the form of a possible decrease or loss of the real return on invested capital compared to the expected one.
Comparison of various options for investment projects and the choice of the best of them is recommended to be made taking into account the use of various indicators, which include:
net discounted income (NPV) or integral effect; profitability index (ID); internal rate of return (GNI); payback period; other indicators reflecting the interests of the participants and its specifics of the project.
Net discounted income (NPV) is determined by the formula:
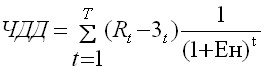
where: Rt is the valuation of the results (the sum of cash inflows) achieved at step t;
3t – cost estimation (investment) in period t;
(Rt – 3t) is the effect achieved at the t-th step.
Net discounted income is the result of the project, which is the sum of the current effects for the entire accounting period, defined as the excess of discounted cash inflows over the amount of discounted investment costs.
When comparing the options for investment projects, the one with the maximum net discounted income is more effective. If the NPV<0, then the project is ineffective, and it should be abandoned.
There are various modifications of the formulas for determining the integral effect, reflecting varying degrees of detail of monetary resources passing through the enterprise during the accounting period, i.e. income and costs.
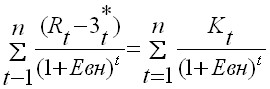
The Pref liability Index (PI) is the ratio of the sum of the effects shown to the amount of capital investment. It is determined by the formula:
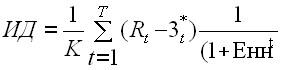
where: 3t* is the valuation of current costs in the t-th step;
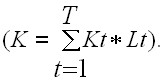
K – the sum of discounted capital investments
The profitability index characterizes the average annual return on invested capital during the accounting period.
This indicator is closely related to net discounted income. If the NDD > 0, then the ID >1 and vice versa. If ID>1, the project is effective, if ID<1 is ineffective. With ID=1, the project is neither profitable nor unprofitable. The criterion for choosing the most effective option is the maximum value of the profitability index.
Unlike net discounted income, the profitability index is a relative indicator. Due to this, it is very convenient when choosing one project from a number of alternative ones that have approximately the same values of NPV, or when completing an investment portfolio with the maximum total value of NPV.
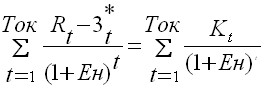
The Internal Rate of Return (GNI) is a discount rate (EWN) at which the magnitude of these effects is equal to the quoted capital investment or the net discounted return is zero:
The reason for calculating this indicator when analyzing the economic efficiency of planned investments is as follows: IRR shows the maximum allowable relative level of income that can be associated with this project. For example, if the project is fully financed by a loan from a commercial bank, the IRR value shows the upper limit of the permissible level of the bank interest rate, exceeding which makes the project unprofitable.
The selection criterion is the maximum IRR value, provided that it exceeds the minimum bank interest rate.
Payback Period (Payback Period) is the minimum time interval (from the beginning of the project), beyond which the integral effect becomes and remains non-negative in the future. In other words, this is the period from which the initial investment and other costs associated with the investment are covered by the total results of its implementation. Simple (diskless) and discount methods of assessing the return on investment allow us to judge the liquidity and riskiness of the project, because long-term payback means reduced liquidity of the project or increased riskiness.
The algorithm for calculating the payback period depends on the uniformity of the distribution of the projected return on investment. If the income is evenly distributed over the years, the payback period is calculated by dividing the one-time costs by the amount of annual income due to them. When a fractional number is obtained, it is rounded upward to the nearest whole. If the profit is unevenly distributed, then the payback period is calculated by directly calculating the number of years during which the investment will be repaid with cumulative income. The general formula for calculating the PP indicator is as follows:
More reasonable is another method of determining the payback period. When using this method, the payback period is understood as the duration of the period during which the amount of net income discounted at the time of completion of the investment is equal to the amount of discounted investments.
The main disadvantage of the payback period as a measure of efficiency is that it does not take into account the entire period of operation of the investment and, therefore, is not affected by all the returns that lie beyond it. Therefore, the payback period should not serve as the main selection criterion. But if the payback period of the project is longer than the adopted restrictions, then the project in question is excluded from the list of possible investment alternatives.
The investment efficiency ratio (R&D) characterizes the annual return on all invested capital, including equity capital. The calculation of this indicator has two features:
does not imply discounting of income indicators; income is characterized by the indicator of net profit PN minus the financial costs associated with servicing the loan.
The calculation algorithm is extremely simple, which implies the widespread use of this indicator in practice: the investment efficiency ratio (ARR) is calculated by dividing the average annual return PN by the average investment value (the coefficient is taken as a percentage). The average value of the investment is divided by the initial amount of capital investments by 2, if it is assumed that at the end of the implementation period of the analyzed project all capital expenditures will be written off, if the presence of residual or liquidation value (RV) is allowed, then it should be excluded.
This indicator is compared with the coefficient of profitability of advanced capital, calculated by dividing the total net profit of the enterprise by the total amount of funds advanced to its activities.
In addition to the considered indicators, other criteria are also used in the evaluation of investment projects, including integral cost efficiency, break-even point, coefficients of financial evaluation of the project (profitability, turnover, financial stability, liquidity), characteristics of the financial section of the business plan. Among the key categories underlying the rationale for the financial plan are the concepts of the flow of real money, the balance of real money and the balance of real accumulated money.
When implementing an investment project, investment, operational and financial activities and inflows and outflows of cash corresponding to these types of activities are distinguished.
The flow of real money is the difference between the inflow and outflow of cash from investment and operating activities in each period of the project. The flow of real money acts in the calculations of commercial efficiency as an effect on the t-th step (Et).
A necessary condition for the adoption of the project is a positive value of the balance of accumulated real money in each period of the project. A positive value indicates the availability of cash in period t, a negative value indicates their lack and the need to attract additional own, borrowed or borrowed funds or reduce operating costs.
None of the listed SAC indicators is in itself sufficient for the adoption of the project. The choice of certain indicators of investment performance is determined by the specific tasks of investment analysis. The degree of objectivity of the investment decision largely depends on the depth and complexity of the assessment of the effectiveness of investments on the basis of the used set of formalized criteria.
The decision to invest in the project should be made taking into account the importance of all the listed indicators and the interests of all participants. An important role in this decision should also be played by the structure and distribution over time of the capital attracted for the implementation of the project, as well as other factors that are amenable only to substantive (and informal) accounting.