The industry of the republic has more than 100 branches in its composition. Leading industries: mechanical engineering and metalworking (22% of the total industrial production); fuel industry (17%), food industry (17%), chemical and petrochemical industry (12%), rice. 7.5.
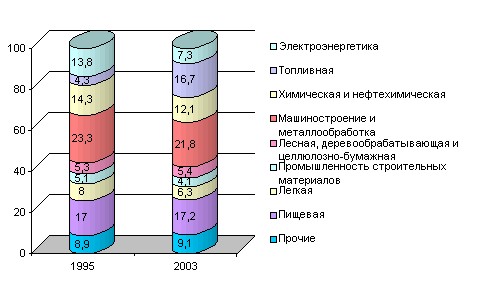
Rice. 7.5. Sectoral structure of industrial production
(in % to total)
In 2003 relative to 1995, the share of the fuel industry in the total volume of industrial production increased the most (from 4.3 to 16.7%), which is associated with an increase in primary oil refining and an increase in the production of certain types of petroleum products.
At the same time, the share of electricity decreased (due to a decrease in production and the expansion of imports), as well as the building materials industry (due to low production investments in the national economy). 7.5.
In terms of the growth of absolute production volumes in 2003 compared to 1990, such industries as follows are the leaders:
forestry and woodworking (223%); ferrous metallurgy (186%); mechanical engineering (173%).
The products of these industries are sold within the republic and are in demand in the foreign market. But there are also industries in which there is a decline in production. These include the fuel industry (53% by 1990), the building materials industry (70%) and the electric power industry (96%). The reasons for the decline in production in these industries are different. Thus, in the fuel industry there is a shortage of imported raw materials. If in
In 1990, 39.4 million tons of oil were processed, then in 2003 – 2 times less.
Table 7.5 Resource requirements by component
Indices of total output by industry
industry (in comparable prices, as a percentage of
previous year)
2000 | 2001 | 2002 | 2003 | 2003/1990 | |
All industry | 108 | 106 | 104 | 107 | 119 |
including: | |||||
Electricity | 97 | 99 | 103 | 100,9 | 66 |
fuel industry | 115 | 105 | 111 | 107 | 53 |
Metallurgy | 110 | 107 | 106 | 107 | 186 |
chemical and petrochemical industry | 103 | 106 | 100 | 109 | 110 |
mechanical engineering and metalworking | 115 | 111 | 106 | 109 | 173 |
forestry, woodworking and pulp and paper industry | 106 | 107 | 106 | 112 | 223 |
building materials industry | 98 | 105 | 107 | 113 | 70 |
light industry | 105 | 100,9 | 98 | 105 | 111 |
food industry | 107 | 110 | 104 | 105 | 138 |
Source: Statistical Bulletin. January-September 2004. – Mn.: Minstat RB, 2004. S.80-81.
The building materials industry has reduced volumes due to low investment volumes. The electric power industry reduces production, on the one hand, due to the introduction of energy-saving technologies, and, on the other hand, due to competing imports, which in the end is more profitable than its own production.
According to the structure of costs for production in industries, the following features take place (according to the results of 2002):
the maximum share of material costs takes place in the fuel industry (80%); the maximum share of labor costs takes place in mechanical engineering (17.7%); the maximum share of social contributions takes place in light industry (7%); the maximum share of depreciation deductions takes place in the building materials and chemical industries (8%).
In 2002, 246 industrial enterprises dominated the market. Of these, by industry:
in the fuel room – 1; in ferrous metallurgy – 2; in chemical and petrochemical – 27; in mechanical engineering – 111; in forestry and woodworking – 13; in the construction materials industry – 16; in the lung – 19; in food – 29.
Annually the volume of production of many of the most important types of industrial products increases in comparison with the crisis of 1995 in 2003, the production of rolled ferrous metals increased by 2.4 times, tires of automobile and for agricultural machines – by 2.1 times, fiberboard – by 2.2 times, paper – by 2.5 times, cement – by 2 times, Table. 7.6.
Table 7.6 Resource requirements by component
Production of the most important types of industrial products
1995 | 2000 | 2001 | 2002 | 2003 | |
Electricity, billion kWh | 24,9 | 26,1 | 25,1 | 26,5 | 26,6 |
Finished rolled ferrous metals, kt | 614 | 1397 | 1418 | 1453 | 1451 |
Automobile tires for agricultural machines, kt. | 1292 | 2440 | 2666 | 2281 | 2765 |
Mineral fertilizers (in terms of 100% nutrients), kt | 3349 | 4056 | 4379 | 4495 | 4953 |
Metal-cutting machines, thousand pieces | 4,7 | 5,4 | 5,7 | 5,8 | 5,2 |
Trucks, thousand pieces | 12,9 | 14,7 | 16,5 | 16,5 | 18,1 |
Trolleybuses, pcs. | 83 | 109 | 62 | 56 | 127 |
Buses, pcs. | 62 | 914 | 460 | 467 | 499 |
Tractors, thousand pieces | 28,0 | 22,5 | 22,7 | 24,3 | 26,7 |
Lumber, thousand m3 | 1702 | 2243 | 2058 | 2193 | 2304 |
Paper, kt | 27 | 44 | 51 | 58 | 67 |
Cement, kt | 1235 | 1847 | 1803 | 2171 | 2472 |
Ceramic tiles, mln. m3 | 8,2 | 12,9 | 16,3 | 16,6 | 17,5 |
Source: Statistical Bulletin. January-September 2004. – Mn.: Minstat RB, 2004. S.82-88.
Much attention in the republic is paid to the quality of products. In 2003, the share of certified products was 55.9% (in 2000 – 48.7%).
The Republic of Belarus exports 90-95% of produced trucks, 80-90% of potash fertilizers and tractors, 80-85% of refrigerators and freezers, 70-80% of chemical fibers and threads, more than half of televisions and tires, almost all manufactured motorcycles and metalworking machines.
In territorial terms, in 2003 compared to 1990 there are the following sectoral shifts:
in the Vitebsk region: growth in the share of the electric power industry and the fuel industry; in the Gomel region: growth in the share of the fuel industry and ferrous metallurgy; in the Grodno region: growth in the share of the chemical industry.
Among the regions of the republic, the highest growth rates in terms of industrial production in 2003 compared to the previous year were observed at the enterprises of Minsk – 109.9%, Brest – 109% and Minsk region – 108.4%.
The largest share in the republic is occupied by the industry of Minsk, the share of which is 21.3% in the total volume of industrial production. The second place in terms of output belongs to the Gomel region – 20.5%, the third is occupied by the Vitebsk region – 17.2%, rice. 7.6.
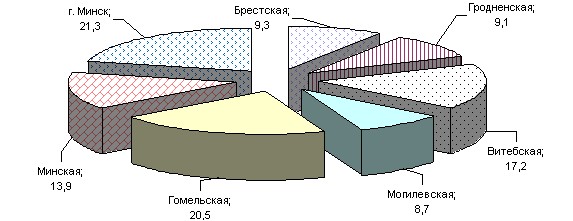
Rice. 7.6. Share of regions in the republican production of industrial products (as a percentage of the total)
The increase in industrial production volumes is mainly due to the growth of labor productivity.
In 2003, in comparison with 2002, labor productivity in the industry of the republic increased by 9.1%, while the volume of production grew by 7.1% and the average number of industrial and production personnel decreased by 1.8%.
The growth of labor productivity in 2003 was observed in all regions of the republic. At the enterprises of the Brest region, it was 110.9%, Minsk – 110.4%, Vitebsk – 109.7%, Minsk – 109.4%, Gomel – 108.5%, Grodno – 108.2% and Mogilev region – 107.4%, [4, p.127].
In general, the specialization of the areas is as follows:
Vitebsk region: | electric power industry, primary oil refining, synthetic resins and plastics, carpets and carpets, hosiery, televisions, shoes |
Gomel region: | primary oil refining, production of steel, metal-cutting machines, paper, fabrics, washing machines, dishes |
Grodno region: | production of cement, tableware, cigarettes |
Minsk | trucks, precast concrete structures, tractors, televisions, washing machines, refrigerators |
Minsk region: | mineral fertilizers, lumber, sugar, mineral water, knitwear |
Mogilev region: | chemical fibers and threads, synthetic resins and plastics, cement |
Brest region: | carpets and carpets, hosiery |