Industry forms the basis of the economy of the republic. In 2003, it accounted for 34% of all fixed assets of the republic, 26% of gross domestic product production, 27% of those employed in the national economy [4, p.118].
In the period from 1991 to 1995, as a result of the crisis, there was a decrease in industrial production in Belarus.
Since 1996, the process of stabilization and growth of production began in the republic, which made it possible in 2000 to reach the level of industrial production in 1990, and in 2003 to exceed this level by 19%.
The Republic of Belarus is one of the 2 CIS countries (together with Uzbekistan) that reached the level of 1990 in terms of industrial production. In 2003 it was only 66.1% in Russia, 81.3% in Ukraine, 79.2% in Kazakhstan, 144% in Uzbekistan, 50% or less in the rest. Indices of total industrial production in the CIS countries in 2003 are presented in Fig. 7.1.
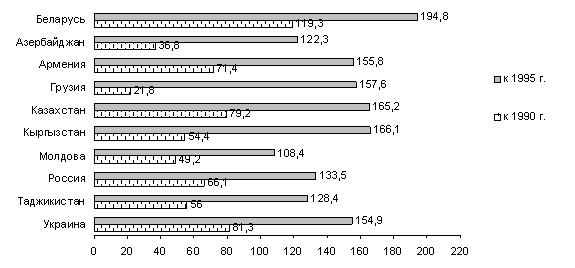
Rice. 7.1. Indices of the total volume of industrial production in the CIS countries in 2003 (in comparable prices; in percentage),
[4, p.119]
In 2003, 2326 enterprises operated in the industry of the republic. They produced 107.1% of the level of
2003 The profitability of the products sold was 12%, Table. 7.1.
Table 7.1 Resource requirements by component
Key performance indicators of the industry
of the Republic of Belarus
1995 | 2000 | 2001 | 2002 | 2003 | |
Volume of production (in actual prices, billion rubles) | 131373 | 105011) | 18612 | 24912 | 33387 |
Indices of total industrial production (in comparable prices) | |||||
in percentage by 1995. | 100 | 164,4 | 174,1 | 181,9 | 194,8 |
as a percentage of the previous year | 88 | 107,8 | 105,9 | 104,5 | 107,1 |
Average annual number of industrial and production personnel, thousand people | 1176 | 1150 | 1124 | 1078 | 1057 |
including workers | 944 | 893 | 868 | 832 | 815 |
Profitability of products sold, percent | 10,1 | 15,8 | 10,9 | 10,5 | 12,0 |
1) Taking into account the denomination (decrease by 1000 times).
The highest growth rates of output to the level of 1995 were achieved by industrial enterprises of Minsk (2.4 times), Brest region (2.2 times) and Minsk region (2 times).
In terms of the production of consumer goods to the level of 1995, the leaders are also the enterprises of the Brest, Minsk regions and
Minsk. Each of these regions and the city of Minsk exceeded the level of 1995 in the production of consumer goods by 2.6 times. 7.2.
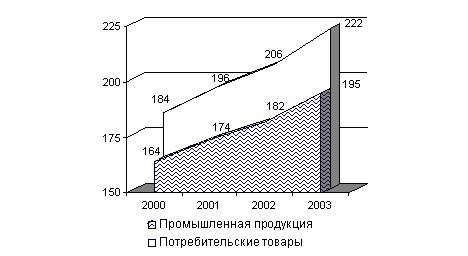
Rice. 7.2. Dynamics of the total volume of production of industrial products and consumer goods (in comparable prices; as a percentage to 1995), [4, p. 121]
The structure of industrial production by forms of ownership has changed significantly. Thus, if in 1995 industrial enterprises of the state form of ownership produced 70.3% of the republican volume of industrial production, then in 2003 – 37.6%.
In 2003, privately owned enterprises produced 60.5% of the volume of industrial production. 7.3.
1995 2003
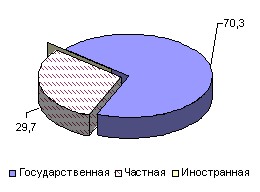
Rice. 7.3. Structure of industrial production by forms of ownership (as a percentage of the total) [4, p.125]
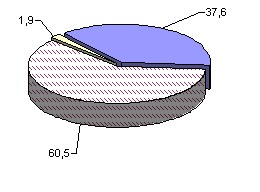
Production of consumer goods in 2003 amounted to 10.3 trillion. rubles, which in comparable prices is 7,8% more than in 2002.
The production of food products increased this year by 7%, non-food – by 9.2%, rice. 7.4.,
Table. 7.2.
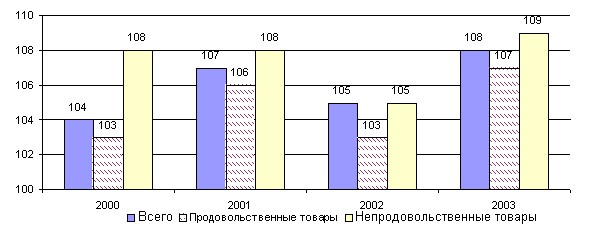
Rice. 7.4. Production of consumer goods (in comparable prices; as a percentage of the previous year) [4, p.132]
With a total increase in the volume of production of consumer goods in 2003 relative to 2000 in 20.5%, in Minsk this increase was 33%, in minsk and Brest regions about 25%.
Among the CIS countries, the Republic of Belarus retains a leading position in the production of many important types of industrial products.
Table 7.2 Resource requirements by component
Production of consumer goods by region (in comparable prices; as a percentage of the previous year)
[4, p.133]
2000 | 2001 | 2002 | 2003 | 2003/2000 | |
Republic of Belarus | 104,1 | 106,8 | 104,7 | 107,8 | 120,5 |
Area: | |||||
Brest | 109,5 | 109,8 | 105,9 | 107,4 | 124,9 |
Vitebsk | 100,0 | 103,0 | 104,4 | 104,8 | 112,7 |
Gomel | 98,8 | 99,1 | 100,0 | 109,0 | 108,0 |
Grodno | 99,1 | 105,8 | 103,2 | 108,4 | 118,4 |
Minsk | 109,6 | 112,7 | 108,5 | 109,2 | 133,5 |
Minsk | 105,2 | 109,1 | 105,0 | 108,4 | 124,0 |
Mogilev | 101,7 | 102,5 | 101,7 | 105,4 | 110,0 |
In the total production volume of the CIS countries, the republic produces 67% of tractors, 49% of chemical fibers and threads, 44% of metal-cutting machines, 23% of mineral fertilizers, 64% of motorcycles, 53% of bicycles, part of the total production of televisions, refrigerators and freezers, knitwear and hosiery, Table. 7.3.
Table 7.3 Resource requirements by component
The share of Belarus in the total volume of production of the most important types of industrial products of the CIS countries, %,
[4, p.130]
1995 | 2000 | 2003 | |
Mineral fertilizers | 20 | 22 | 23 |
Chemical fibers and filaments | 44 | 53 | 49 |
Synthetic resins and plastic masses | 19 | 16 | 12 |
Metal-cutting machines | 16 | 35 | 44 |
Tractors | 42 | 47 | 67 |
Trucks | 8 | 7 | 8 |
Refrigerators and freezers | 23 | 31 | 22 |
Television | 14 | 26 | 18 |
Bikes | 30 | 48 | 53 |
Motorcycles | 36 | 56 | 64 |
Fabrics of all kinds | 8 | 9 | 7 |
Hosiery | 10 | 23 | 18 |
Jerseys | 16 | 30 | 18 |
Leather shoes | 13 | 22 | 13 |
Belarus has one of the highest per capita production rates of certain types of industrial products in the CIS.
Thus, in 2003 per capita:
cement, kg
in Belarus – 250, Russia – 285, Ukraine – 186, Kazakhstan – 172;
fabrics, m2
in Belarus – 26, Russia – 20.1, Ukraine – 1.5;
shoes, pairs
in Belarus – 1.1, Russia – 0.3;
animal oil, kg
in Belarus – 6.5, Russia – 1.9;
whole milk products, kg
in Belarus – 93.7, Russia – 54.
Per 1000 population, the following were produced:
refrigerators and freezers, pieces
in Belarus – 90, Russia – 15, Ukraine – 18;
TVs, pieces
in Belarus – 70, Russia – 16, Ukraine – 5.
However, despite the successes achieved, for some types of traditionally produced products there is a serious decline, Table. 7.4.
Table 7.4 Resource requirements by component
Volumes of production by individual types of products in physical terms in 2003 relative to 1990,%
Types of products | Production in 2003 to the level of 1990 | Reasons for the decline Production |
Electric power | 67,3 | Reduced demand and high cost of own production |
Primary oil refining | 40 | Reduction in the supply of raw materials from Russia |
Gasoline automobile | 43 | |
Diesel fuel | 64 | |
Heating oil | 28 | |
Fuel briquette | 55 | Lack of raw materials |
Synthetic resins | 64 | Lack of demand |
Chemical fibers | 40 | Lack of demand |
Mineral fertilizers | 83 | Lack of demand |
Tires | 60 | Low quality even for the domestic market |
Electric motors | 36 | Lack of demand |
Metal-cutting machines | 32 | Lack of demand |
Trucks | 43 | Lack of demand |
Tractors | 27 | Lack of demand |
Lighting lamps | 50 | Lack of demand |
Forage harvesters | 1,2 | Lack of a successful model, high price |
Buses | 50 | Lack of demand |
Industrial Sewing Machines | 6 | Lack of demand |
Elevators | 25 | Low quality |
Bearings | 20 | Low quality |
Paper | 30 | No pulp production |
Lumber | 41 | Low quality, lack of demand in the foreign market |
Brick | 35 | Lack of demand due to lower investment |
Slate | 20 | |
Soft roofing materials | 18 |
Source: Statistical Bulletin. January-September 2004. – Mn.: Minstat RB, 2004. S. 83-88.
The main reason for the decline is the decline in demand for Belarusian products in the domestic and foreign markets.