The placement of productive forces is the distribution in space of their individual elements. It shall be carried out in accordance with the following principles:
1. Adjustability and proportionality, which provides for the optimization of territorial proportions. This principle, in particular, should be manifested in equalizing the level of economic development of individual territories, rationalizing economic ties.
Regulators of the placement process in a market economy are:
regional tax incentives; soft loans; creation of free economic zones; infrastructure support of the regions.
2. Rationality, which involves the creation of opportunities:
maximizing profits from the operation of the TC (TPK); maximizing the standard of living of the population; minimizing the level of environmental tension; prevention of commodity shortages; ensuring state security.
3. Complexity, which means the creation of three groups of interrelated industries in a certain territory:
specialization; service and auxiliary.
Branches of specialization express the orientation of the economy to the production of products for use outside the region in the general system of division of labor.
The service and auxiliary branches of production should ensure the effective functioning of the branches of specialization. The complexity of the region’s development ultimately means:
(a) Proportional development of the extractive and manufacturing industries with the availability of minerals;
b) economically and socially acceptable level of employment of the male and female population;
c) coordinated development of production and production infrastructure;
d) development of non-production infrastructure in accordance with the size and demands of the population.
Complexity contributes to the formation of such mutual
Links between the elements of economy, when, with the effective performance of their main functions, there are no certain disproportions in production or the social sphere.
Thus, the complex distribution of productive forces is designed to solve the following problems:
ensuring the effective functioning of the industry; effective use of local conditions and resources; elimination or elimination of the possibility of territorial imbalances.
The use of the above principles involves taking into account the following groups of factors in the allocation of productive forces:
organizational and economic (concentration, specialization, cooperation, combination of production); natural conditions and resources; socio-economic (economic and geographical location, scientific and production potential of the territory, population, labor resources, environmental factors, etc.).
For example, the well-known company “General Electric” takes into account 187 factors when placing production.
Methods of determining the branches of specialization [7, p.129]
The definition of the branches of specialization of the TC involves the calculation of the coefficients C1 (index of the level of sectoral specialization of the district), C2 (index of the level of district specialization in the production of a particular product), Svyv (index of export of products from the region) and SDP (index of per capita production). Let’s consider the methods of their calculation and examples.
1. Index of the level of sectoral specialization of the region:  ,
,
where ![]()
![]() is the share of the industry in question in the total production of the region;
is the share of the industry in question in the total production of the region;
![]()
![]() – the share of the industry in question in the production of this type of product in the country.
– the share of the industry in question in the production of this type of product in the country.
If C1 ≥ 1, then the industry in question belongs to the branches of specialization.
Example 1. There are two regions producing two types of products (1 and 2) in the following volumes:
Region I | Region II | |||
Types of products | 1 | 2 | 1 | 2 |
Volumes of output, units. | 10 | 90 | 80 | 120 |
Share of output in the total volume of production of the region | 0,1 | 0,9 | 0,4 | 0,6 |
It is necessary to answer the question of what type of products each region specializes in.
Decision:
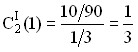
1. For region I and for product 1, let’s calculate the value of the coefficient C1:
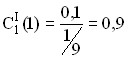 (<1), therefore, Region I does not specialize in the production of the first type of products.
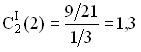
2. For region I and for product 2, let’s also calculate the value of C1:
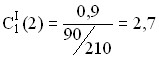 (>1), therefore, Region I is special
is used in the production of products of the second type.
3. Let’s calculate similar coefficients for region II and for both types of products:
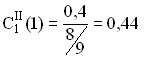 (<1), therefore, Region II is not a specialty.
is used in the production of products of the first type.
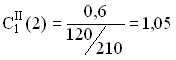 (>1), therefore, Region II specializes in the production of the second type of products.
Conclusion: Products of the second type are products of specialization of both regions.
2. Index of the level of district specialization:  ,
,
where ![]()
![]() is the share of the product in question produced in the region in the total volume of these products produced in the country;
is the share of the product in question produced in the region in the total volume of these products produced in the country;
![]()
![]() – the share of all products of the region in the total volume of production of all types of products in the country.
– the share of all products of the region in the total volume of production of all types of products in the country.
If C2≥1, then the area under consideration is an area specializing in the production of products of this type.
Example 2. For the conditions set out in Example 1, identify the branches of specialization of the areas.
Decision:
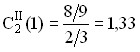
1. For region I, let’s calculate the indices of district specialization for both types of products:
 , therefore, Region I does not specialize in the production of the first type of products.
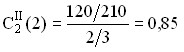
 , therefore, Region I specializes in the production of products of the second type.
2. For region II, we will also calculate the indices of district specialization:
 , therefore, region II specializes in the production of products of the first type.
 , therefore, Region II is not a specialty-
it is called on the production of products of the second type.
Conclusion: Region I specializes in the production of products 2, and region II – in the production of products of the first type.
The considered indicators C1 and C2 are calculated both for the number of IFRs and for the volumes of fixed production assets in industries.
3. Index of export of products from the region: ![]()
![]() ,
,
where Y is the value of exported products of a certain type;
P is the volume of production of these products.
4. Per capita production index:  ,
,
where ![]()
![]() is the share of the region in the production of products in the country;
is the share of the region in the production of products in the country;
![]()
![]() – the share of the region in the population.
– the share of the region in the population.
If ![]()
![]() ≥ 1, then the industry in question belongs to the branch of specialization of the region.
≥ 1, then the industry in question belongs to the branch of specialization of the region.
Sectoral structure of the national economy
The sectoral structure characterizes the ratio of the shares of individual industries in the total social product, as well as in its components of the natural-material (intermediate and final product) and value structure (material costs, value added).
In the structure of the total social product, the share of goods is decreasing (mainly at the expense of industry) and the share of services is growing (largely due to trade), Table 2. 6.1.
Table 6.1 Resource requirements by component
Sectoral structure of the total social product of the Republic of Belarus in 2001 and 2002 (%), [10, p.325-328]
Industry | Years | Change (2002 – 2001) | |
2001 | 2002 | ||
Production of goods | 67,3 | 65,0 | – 2,3 |
of them in the following industries: | |||
industry | 48,9 | 46,7 | – 2,1 |
agriculture | 12,0 | 12,2 | + 0,2 |
construction | 5,7 | 5,5 | – 0,2 |
Production of services | 32,7 | 34,8 | + 2,1 |
of them in the following industries: | |||
transport | 7,2 | 7,1 | – 0,1 |
trade and catering | 7,3 | 8,0 | + 0,7 |
HOUSING | 4,1 | 3,2 | – 0,9 |
health, physical education, social security | 3,1 | 2,5 | – 0,6 |
education | 3,3 | 1,6 | – 1,7 |
management | 2,5 | 1,5 | – 1,0 |
This trend, in our opinion, is negative, since the republic should increase its export potential, primarily through the production of competitive products. As for increasing the share of trade, this is mainly nothing more than a trade margin, i.e., in fact, overpricing due to repeated repurchase of goods.
The dynamics of the sectoral structure of gross value added (value added taking into account depreciation) also reflects an increase in the share of services and a decrease in the share of production of goods, Table 2. 6.2. Thus, from 1995 to 2002, the total share of value added in industries producing goods decreased by 26 percentage points (from 68.9 to 41.3%), the share of industry and agriculture – by about 12 percentage points.
But the total share of value added in the sphere of services production increased by 18 percentage points (from 28.5 to 46.5%). In the future, the share of added value in the sphere of production of goods, as we believe, should stabilize, since the basis of the economy is still material production.
Table 6.2 Resource requirements by component
Sectoral structure of gross value added
in the Republic of Belarus, [2, p.331; 10, p.326-327]
Industry | Years | Change in 2002 compared to 1990 | ||
1990 | 1995 | 2002 | ||
Total value added | 100,0 | 100,0 | 100,0 | |
Production of goods | 68,9 | 49,2 | 41,3 | – 27,6 |
of them in industries | ||||
industry | 37,9 | 27,6 | 26,0 | – 11,9 |
agriculture | 22,7 | 15,1 | 9,0 | – 13,7 |
construction | 7,7 | 5,4 | 5,3 | – 2,4 |
Production of services | 28,5 | 44,5 | 46,5 | + 18,0 |
of them in industries | ||||
transport | 5,4 | 10,3 | 9,3 | +3,9 |
trade and catering | 3,4 | 7,6 | 10,4 | +7,0 |
The sectoral structure of the national economy characterizes the shares of its constituent parts. But in different aspects. If we consider the reproductive aspect, we are faced with the so-called reproductive structure, which will be discussed below.