At the heart of the categories under consideration is the concept of “economy”, which is quite polysemantic. Economics means: 1) a historically defined set of socio-production relations (the economy of capitalism, the economy of socialism, the economy of post-industrial society, the market economy, etc.); 2) the national economy of several or separate countries, as well as its constituent parts (industrial economy, agricultural economy, etc.); 3) a branch of science that studies economic relations.
In our case, the economy is considered as a set of economic units. And depending on the size of the object , the economy in this sense can include the national economy of the whole planet (“world economy”), individual continents or interstate associations (“regional economy”), individual countries (“national economy”) or separate areas in these countries (the term “regional economy” is also used here).
Indicators of social and economic
efficiency of the national economy and its branches
A socially-oriented market economy is being built in the Republic of Belarus. This direction is implemented through a purposeful social policy, which is a set of principles, norms and methods used by the state to regulate the socio-economic conditions of society.
The organizational and material and technical basis of social policy is the national economy and, above all, its social sphere.
Continuing education | Conditions Labor | Housing and household Services | Objects cultures, their accessibility | Social Services |
Health care | Social guarantees and protection | |||
Employment |
The social sphere is a set of sectors of the economy, as well as economic relations that ensure the reproduction of human potential and a decent life for all members of society.
Since the category of “efficiency” reflects the ratio of national economic results and costs incurred, many indicators of social development (for example, the level of education) and the development of the social sphere (for example, the provision of medical institutions) cannot be attributed to indicators of effectiveness in their pure form.
A number of them reflect the social consequences of economic development (e.g. mortality, injuries, environmental pollution), which are essentially costs.
Other indicators can be considered certain signs of positive achievement. For example, the same level of education. However, the latter also carries a tinge of cost, since people are forced to receive a certain level of education to acquire a profession.
In general, social efficiency is associated with the ultimate goal of production. It reflects the distributive aspects of reproduction.
Social and economic efficiency are closely linked. Moreover, as noted by V.S. Mavrischev [5, p.5], social efficiency is the main thing, because any economic measures aimed at increasing economic efficiency are acceptable only when they lead to an improvement in the living conditions of workers.
Therefore, as it seems to us, the indicators of social efficiency of the economy should include the main “social results”: the demographic situation, the parameters of morbidity, employment, level of education, crime, emigration (and immigration), suicidality, Fig. 1.2.
The composition of indicators for the named blocks in the statistics is processed, and most of them are published, Table. 1.1 [5, c.6-7].
Table 1.1 Resource requirements by component
Social outcomes of economic development
Sphere of public economy | Social outcomes | Economic Evaluation indicators |
Material production | Reducing the level of occupational morbidity and occupational injuries; improving the psychophysiological state of employees and increasing their working capacity; changes in the content of work and reduction of staff turnover | Increase in the volume of value added at enterprises of material production; saving money from public consumption funds for social insurance; saving self-supporting funds of enterprises by reducing the volume of heavy and harmful work |
Non-production | Reducing the incidence rate by improving the living conditions and sanitary and hygienic condition of settlements; reduction of transport fatigue; reducing the number of road traffic accidents; reduction of time spent by the population on the use of services, on movement to the place of work, etc. | Increase in the volume of value added at enterprises of material production; savings from public consumption funds for social insurance and health care |
Final personal consumption | Reducing the cost of repairing household goods; reducing the incidence of the population; reducing the time spent on household chores | Savings of the population’s funds; increase in free time |
Natural environment | Reducing the level of morbidity of the population by maintaining the purity of the natural environment; increase of efficiency; reducing the migration of workers for environmental reasons, etc. | Increase in the volume of value added; saving money from public consumption funds for social insurance and health care |
When analyzing the level of social efficiency, it is necessary to select such indicators that reflect the specifics and features of the system under consideration. The same should be taken into account when interpreting the results obtained.
However, indicators of social efficiency cannot be separated from indicators of economic (production) efficiency, since the economic system is a single whole.
The essence of economic efficiency is to reduce the total costs of social labor per unit of production.
In view of the complexity of the structure of social production, costs and results have various modifications. This is the reason for the impossibility of expressing the economic efficiency of production using only one indicator.
The whole variety of indicators of economic efficiency is divided into two groups: private and general. Particular indicators characterize the efficiency of the use of certain types of resources. Among the most important of them are labor, raw materials and materials, capital. The efficiency of the use of these resources is characterized respectively by labor intensity (Te), material intensity (Me) and capital intensity of products (Fe).
Labor intensity characterizes the cost of living labor per unit of the effect produced, most often per unit of gross output or value added. At the same time, labor costs, depending on the level at which the labor intensity is calculated, can be expressed in the average annual number of workers, the time worked (man-days, man-hours), or in wages. In practice, most often they operate with an indicator that is the opposite of labor intensity – labor productivity.
The growth of the productivity of social labor is the main factor in the growth of social production, national welfare, and the solution of social problems of the development of society.
The share of gross domestic product growth as a percentage (ΔVVP (in %)) as a result of increased labor productivity and changes in the number of employees is determined by the formula:
![]()
![]() (%),
(%),
where ΔCh (%) is the increase in the number of employees (in percentage);
ΔP (%) – increase in labor productivity (in percentage);
ΔP and ΔCh – absolute increases in labor productivity and numbers;
GDP is the absolute value of GDP in the base year.
In turn, each of these elements is determined by the impact of a whole group of factors acting, as a rule, in different directions. Thus, the technical level of production contributes to the growth of productivity of living labor, but increases the capital intensity of products. The organization of production and labor, the quality of labor also contribute to the growth of labor productivity, but require additional costs for equipment, training. Therefore, labor productivity should be analyzed taking into account the factors that determine it, which include material intensity and capital intensity.
Material intensity expresses the amount of material costs per unit of output (GDP) and characterizes the efficiency of the use of labor objects (working capital). Quantitatively, it is calculated by dividing the size of raw materials, materials, fuel, energy, semi-finished products and components consumed in production (in value or physical terms) by the volume of output or GDP produced.
If it is necessary to focus on the efficiency of the use of specific types of resources, then appropriate indicators are used, for example, energy intensity (characterizes the level of consumption of fuel and energy resources within a country per unit of production) or metal intensity (characterizes the level of metal consumption per unit of production).
Capital intensity characterizes the efficiency of the use of fixed production assets and is defined as the ratio of their value in the average annual calculation to the magnitude of the effect – output or GDP. Taken in inversely, it is called capital return (Fo), which is most often operated in practice.
Comprehensive saving of material resources is one of the most important signs of intensive economic development. For the Republic of Belarus, this problem is very relevant. This is due to the fact that most industries of the republic work mainly on imported raw materials, materials, fuel. Due to imports, the industry provides 90% of its needs for oil, 100% for natural gas and coal, 100% for cotton, about 75% for rolled ferrous metals.
Each of these indicators is of great importance for characterizing the effectiveness of the use of various types of costs and resources – material costs, fixed production assets, labor resources. But none of them, taken separately, can characterize the level of efficiency of production as a whole, i.e. the efficiency of using the total costs of social labor. Therefore, it is impossible to judge the efficiency of production only on the basis of the dynamics of capital return or labor productivity, as this is often observed in the literature and in practice. Moreover, even on the basis of all the main indicators (Te, Me, Fe) taken together, it is not always possible to give an unambiguous answer to the question of how the efficiency of production as a whole has changed. This is explained by the fact that the dynamics of these indicators may not always be unidirectional. In some cases, they change in diametrically opposite directions – some improve, others worsen.
On the issue of generalizing indicators of production efficiency, there is no consensus either in theory or in practice. In the spirit of the long-standing recommendations of the USSR State Planning Committee, the following are recommended as generalizing indicators of production efficiency:
at the level of the national economy as a whole: GDP growth rates per capita; production of GDP per ruble of expenditure; national economic profitability as the ratio of net income (profit and turnover tax) to the average annual value of production assets; the costs of production and circulation per ruble of the social product; relative savings in the sphere of material production of various types of resources and costs (production assets, material costs, wage fund). at the level of branches of material production, associations and enterprises: growth rates of production (net, gross, commodity); net products for one ruble of expenditure; overall profitability; costs per ruble of marketable products; relative savings of costs and resources (according to their types).
Not all recommended summary indicators of production efficiency are indisputable. For example, the growth rate of GDP per capita depends not only on the efficiency of social production, but also on the dynamics of the country’s population. The latter is determined by factors, many of which lie outside the sphere of production. This indicator characterizes rather not economic, but social efficiency, i.e. the effectiveness of the entire process of social reproduction from its ultimate goal. And the indicator “production growth rates” is generally unsuitable for characterizing efficiency, since it characterizes only the result of production, regardless of the costs and resources by which the corresponding growth rates of production are achieved.
In this regard, it should be noted that since production efficiency is expressed by the relationship between results and costs, it is obvious that performance indicators should be constructed on the basis of this ratio. Therefore, by their nature, they should not be absolute, but relative values. Therefore, the growth rates of production, the absolute (volumetric) values of profit, GDP, etc. in themselves, regardless of the magnitude of the costs of social labor, at the cost of which they are achieved, can characterize only the magnitude of the economic effect, but not the level of efficiency.
To analyze the economic efficiency of production in the literature, the general efficiency coefficient is used as a generalizing indicator, which represents the ratio of the annual gdp (net output for the industry) to the average annual value of production assets. An increase in this indicator can be achieved both by saving current costs implicitly reflected in the numerator of the formula, and by one-time costs (capital investments) reflected in its denominator.
In industry, the indicator of profitability is widely used as a generalizing indicator as the ratio of profit to production assets. Unlike national economic profitability, calculated on the basis of the entire mass of net income, the profitability of the industry is calculated only on the basis of a part of net income (profit). And rightly so.
Profitability is a generalizing indicator in the sense that it accumulates the impact of all major performance indicators. After all, profit, on the basis of which profitability is calculated, is the difference between the volume of products sold and its cost. The volume of sales will be the greater, and the cost price the less, the better the labor force, material resources and fixed assets are used. In addition, the profitability indicator is clear and understandable.
The coefficient of overall efficiency and profitability, as generalizing performance indicators, are calculated not on the basis of costs, but on the basis of resources, and then not all, but only production assets, without taking into account labor resources. Therefore, some researchers propose in the denominator of these formulas to add to the production funds the annual wage fund, which characterizes the amount of labor resources consumed per year and thereby take into account all the resources used.
Obviously, such a proposal is incorrect for methodological reasons. It is impossible to mechanically sum one-time costs, which are in the form of the applied production assets, with the current labor costs in the form of wages. Such summation is devoid of economic sense, because production funds and the annual wage fund have different dimensions – the latter is measured in rubles per unit of time (year, quarter, month), and production funds are also in rubles, but regardless of the unit of time.
Some researchers construct a summary of production efficiency on the basis of costs, but without taking into account resources:
![]()
![]() ,
,
where C is material costs, including depreciation;
V – wage fund in material production;
m – productive accumulation fund.
It seems to us that it is more correct to calculate a generalizing indicator of efficiency on the basis of all costs and resources (production assets). In this regard, two questions arise – firstly, how methodologically justified is the summation of current costs (cost of production) and one-time investments (production assets) and secondly, if this is justified, then what should be the mechanism for their summation.
The connection of current costs and production assets in some single generalizing indicator of efficiency is possible if there is an internal real connection between these values. There is such a connection and it consists in the fact that one-time costs (capital investments), which take the form of production assets, are aimed at a relative reduction in current costs. In other words, savings on current production costs are bought at the cost of additional capital investments directed to new more efficient means of production.
It is difficult to answer the second question – how to sum up current and one-time costs, i.e. production costs and production assets that are diverse in economic nature. Directly, directly summarizing them is pointless. It is possible to sum up current and one-time costs only if you bring them to the same unit of time, to the same dimension. Since current costs are usually taken for a period of time equal to a year, then one-time costs should be brought to this value. Reduction of different costs to the same dimension in design and planning practice is carried out using the normative coefficient of economic efficiency (Yen). With the help of the efficiency standard, production assets are brought into a form comparable to current costs and summed up according to the formula:
C + ENF (where C is the current costs of production (cost of production; F – production assets).
The formula (C + ENF) is widely used in design practice to determine the costs given. It shows the value of current costs for production in the absence of one-time investments. Of course, this is a conditional assumption, because the production process cannot be carried out without one-time investments in production assets. But at the same time, this assumption reflects the real economic relationship between current and one-time costs, their known interchangeability.
From all of the above, it follows that the essence (criterion) of production efficiency is reduced to saving the total costs of social labor per unit of effect, and the generalizing indicator (quantitative measure) of this criterion can be the ratio:
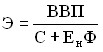 .
.
It should be noted that the assessment of the economic efficiency of production on the basis of a generalizing indicator should be supplemented by an analysis of other performance indicators.
Of particular importance in the analysis of the national economy is the efficiency not only of all costs as a whole, but also the effectiveness of investments.
The criterion for the national economic efficiency of capital investments in the country as a whole is the ratio of GDP growth (and at other levels of management – the increase in value added) to capital investments that caused this increase.
At the self-supporting level of management and, in particular, when using the bank’s own funds and loans for the development and implementation of appropriate measures, the effect of capital investments is estimated by the increase in profits.
When calculating the overall economic efficiency of capital investments, the following indicators are used:
1. On the national economy as a whole, its branches
![]()
![]() ,
,
where ΔVDP is the annual GDP growth;
K – capital investments that caused this increase
2. By branches of industry, agriculture, transport, communications, construction, trade, complex capital construction programs, certain technical and economic problems:
![]()
![]() ,
,
where ΔDS is the increase in value added.
3. For industries where the cost reduction indicator is used for efficiency calculations, the indicator of overall economic efficiency is determined by the ratio of savings from reducing the cost of production to the capital investments that caused this savings:
![]()
![]() ,
,
where C1, C2 is the cost of production, respectively, before and after capital investments.
4. For long-term integrated programs, it is recommended to determine the cumulative effect obtained as a result of capital investments, with the definition of the period during which the amount of the effect will equal or exceed the amount of capital investments. For programs implemented with the use of loans or at the expense of the industry’s own funds, the amount of profit received over the same period is also estimated by the cumulative total. The period determined in this way is considered a conditional period of return on capital investments.
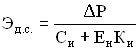
The methodology for calculating absolute economic efficiency for environmental protection measures has some peculiarities. Thus, the indicator of absolute economic efficiency of all environmental protection costs is defined as the ratio of the annual volume of the total economic effect to the given costs:
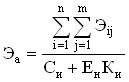 ,
,
where aij is the economic effect of the i-th type from the prevention (reduction) of losses at the j-th object located in the zone of improvement of the state of the environment;
C – annual operating costs for maintenance and maintenance of fixed assets, according to which the full economic effect is determined;
Yen – normative coefficient of efficiency of capital investments;
Ki – capital investments in the construction of an object (or a group of objects) for environmental protection purposes.
If it is necessary to determine the indicator of absolute economic efficiency of capital investments for environmental protection measures, the calculation is made according to the formula:
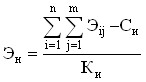 .
.
Additional indicators of the absolute effectiveness of environmental protection measures can be:
The ratio of the reduction ΔB of the indicator characterizing the negative impact of the production activities of enterprises on the environment to the costs that caused it:
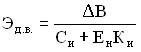 ;
;
The ratio of the ΔP indicator, which characterizes the improvement of the state of the environment of the region, to the costs that were required for this:
 .
.
In the practice of design and planning, as a rule, several options for design or technical solutions are considered, which differ not only in the costs of their implementation, but also in the current ones per unit of production. To choose the best option, the comparative efficiency of capital investments is calculated, which characterizes the advantages of one option over others.
Calculations of the comparative economic efficiency of capital investments are used when comparing options for economic or technical solutions, choosing interchangeable products, introducing new types of equipment, etc. The following cases are possible:
1. One of the options is characterized by lower unit capital costs and lower production costs. Its advantages are obvious, and therefore there is no need to calculate indicators of comparative efficiency.
2. Much more often, lower operating costs correspond to higher capital investments. At the same time, there is a need to determine what is more profitable for the national economy: with large capital investments, then get cheaper products or, with lower capital costs, get more expensive products. The problem is solved by comparing the necessary additional capital investments with savings on current costs. Capital and current costs are compared by the payback period of additional capital investments or its inverse value – the comparative efficiency coefficient.
The payback period of additional capital investments T is the period of time during which additional capital investments are reimbursed due to savings from reducing the cost of production:
 , (1.1)
and the coefficient of comparative efficiency of additional capital investments:
 (1.2)
(1.2)
where C1, C2 is the cost of production according to the compared options;
K1, K2 – capital investments according to the compared options.
The efficiency coefficient of additional capital investments and their payback period obtained by the calculation are compared with the normative values.
The normative coefficient of comparative efficiency characterizes the minimum reduction in the cost per unit of additional capital investments according to the compared options, in which these additional capital investments can be recognized as effective. This standard is intended for the selection of an option and should not be identified with the standard of overall efficiency.
With E > Yen or T > Tn, additional capital investments and a more capital-intensive option are considered effective. To choose the best option, you can also use the indicator of the listed costs.
The most effective option is considered to be with minimal costs:
![]()
![]() , (1.3)
, (1.3)
where Ci is the current costs (cost) of the i-th option;
Yen – normative coefficient of comparative efficiency of capital investments;
Ki – capital investments according to the i-th option.
Indicators Ki and Ci can mean, respectively, the full amount of capital investments and the cost of annual production or specific capital investments and unit cost of production.
The decision on the feasibility of implementing certain options for design solutions is made on the basis of calculating the annual economic effect of the compared options:
![]()
![]() (1.4)
(1.4)
In some cases, when the costs given for the compared options differ slightly, it is recommended to use additional natural indicators. These include the norms of consumption of raw materials, materials, fuel per unit of production, the coefficient of metal use, the removal of products from 1m2 of production area or a unit of equipment, etc.
The annual economic effect of the introduction of new technological processes, mechanization and automation of production, methods of organizing production and labor, providing savings in the production of the same products, is determined by the formula:
![]()
![]() , (1.5)
, (1.5)
where Z1, Z2 are the quoted unit costs
(works) carried out with the help of basic and new equipment;
А2 – annual volume of production (works) with the help of new equipment in the accounting year (in physical units).
The calculation of the annual economic effect from the production and use of new means of labor of long-term use (machines, equipment, devices) with improved quality characteristics (productivity, durability, etc.) is made as follows:
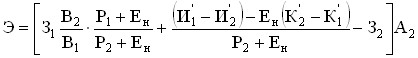 , (1.6)
where Z1, Z2 are the given costs per unit of the basic and new means of labor, respectively;
B2/ B1 – a coefficient that takes into account the increase in the productivity of the unit of the new means of labor in comparison with the basic one;
B1, B2 – annual volumes of output (work) produced when using a unit of the basic and new means of labor (in physical units), respectively;
 – a coefficient that takes into account the change in the service life of the new means of labor in comparison with the basic one;
P1, P2 – shares of deductions from the book value for the complete restoration (renovation) of the basic and new means of labor, are calculated as values opposite to the service life of the means of labor, determined taking into account their moral aging;
Yen = 0.15;
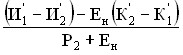 – savings of the consumer enterprise on operating costs and deductions from related capital investments for the entire service life of the new means of labor compared to the basic one, rubles;
![]()
![]() – concomitant capital investments of the enterprise-consumer (without taking into account the cost of the considered means of labor) when using the basic and new means of labor, respectively, based on the volume of production (work) produced with the help of the new means of labor, rubles;
– concomitant capital investments of the enterprise-consumer (without taking into account the cost of the considered means of labor) when using the basic and new means of labor, respectively, based on the volume of production (work) produced with the help of the new means of labor, rubles;
![]()
![]() – annual operating costs of the enterprise-consumer when using the basic and new means of labor, respectively, based on the volume of products (work) produced with the help of the new means of labor, rubles These costs take into account only part of the depreciation costs for the overhaul of labor facilities, i.e. without taking into account the funds for their renovation, as well as depreciation deductions for the accompanying capital investments of the consumer enterprise;
– annual operating costs of the enterprise-consumer when using the basic and new means of labor, respectively, based on the volume of products (work) produced with the help of the new means of labor, rubles These costs take into account only part of the depreciation costs for the overhaul of labor facilities, i.e. without taking into account the funds for their renovation, as well as depreciation deductions for the accompanying capital investments of the consumer enterprise;
A2 – the volume of production of new means of labor in the accounting year (in physical units).
Annual economic effect from the production and use of new or improved objects of labor
(materials, raw materials, fuels), as well as means of labor with a service life of less than one year, is calculated by the formula:
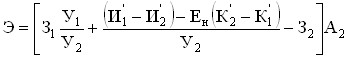 , (1.7)
where Z1, Z2 are the given costs per unit of the basic and new subject of labor, rubles, respectively;
U1, U2 – unit costs when using the basic and new item of labor respectively per unit of output (work) produced by the consumer (in physical units);
![]()
![]() – operating costs per unit of production (work) of the enterprise-consumer when using respectively the basic and new items of labor without taking into account their value, rubles;
– operating costs per unit of production (work) of the enterprise-consumer when using respectively the basic and new items of labor without taking into account their value, rubles;
![]()
![]() – concomitant capital investments of the enterprise-consumer when using the basic and new objects of labor per unit of production (work) produced with the use of a new object of labor, rubles;
– concomitant capital investments of the enterprise-consumer when using the basic and new objects of labor per unit of production (work) produced with the use of a new object of labor, rubles;
A2 – the volume of production of a new item of labor in the accounting year (in physical units).
Annual economic effect from the production of new products or products of increased quality (with a higher price)
![]()
![]() , (1.8)
, (1.8)
where P is the profit from the sale of new products or the increase in profit from the sale of products of increased quality;
![]()
![]() – specific capital investments for the production of new products or specific additional capital investments related to improving the quality of products, rubles;
– specific capital investments for the production of new products or specific additional capital investments related to improving the quality of products, rubles;
А2 – the volume of new products or products of increased quality in the year (in physical units).
Thus, the totality of numerous indicators of the efficiency of social production can be represented through the corresponding groups of indicators.
First, they can be resource or costly, as noted above. Secondly, the indicators used may reflect total costs, for example, production costs per ruble of GDP, ND, or the use of a specific resource (energy intensity, metal intensity). Thirdly, they may differ from each other in the method of construction: level, tempo, incremental. Fourth, they can only be relative. And, fifthly, natural and valuable.
All these indicators are applied to the object in question – the national economy as a whole, industry, ministry, firm, enterprise. The choice of an indicator depends on the goals set and the tasks to be solved, as well as on the characteristics of a particular object, the effectiveness of which is calculated.