Assessment and comparative analysis of the role of foreign trade in the framework of macroeconomic indicators and foreign trade quotas
All countries, to one degree or another, are participants in the modern world economy. The activity of this participation, the degree of integration of individual countries into the world economy are different, but there is no country that is not bound by the threads of economic interaction with the outside world. The increased scale and diversity of world economic relations are expressed, in particular, in an increase in the number and volume of economic operations between countries, a change in structural relations between them, a transformation of the nature of these operations, and an increase in the degree of their impact on the economies of individual countries and on the entire world economy. The whole complex range of economic and political relations between the state and other countries, the nature of which depends both on the development of the domestic economy and on changes in other countries and the world market, is reflected in the balance of payments.
Due to the fact that the balance of payments is a tool for analyzing international trade flows, the main principle of its compilation is uniformity, i.e. common standards for representing components for countries participating in international trade. For many years, the standards for compiling and maintaining balance of payments statistics have been supported by the International Monetary Fund (IMF) and are reflected in the relevant methodological publications. From the very beginning of its existence, the IMF has developed, maintained and disseminated standards that allow for the preparation of reliable data on balance of payments statistics. Since the first edition of the Balance of Payments Manual (hereinafter referred to as the Guide), published in 1948, all subsequent editions of it have been devoted to the presentation of methodological principles for compiling the balance of payments, the development of which took place along with changes in the economic conditions of world trade. Moreover, in view of the fact that the economies of various countries of the world over the post-war decades are becoming more and more interdependent, the need for statistics, which reflects the prevailing trend towards increasing liberalization and integration of world markets, has increased over time. And since there is an inextricable link between the internal economic development and foreign economic activity of any country, timely, reliable and comprehensive balance of payments statistics based on a clear, analytically oriented approach, is currently an indispensable tool for economic analysis and the formulation of economic policy.
The methodological principles for collecting and compiling balance of payments data are set out in the “Balance of Payments Manual”, which is used by all statistical units of the IMF member countries (the 4 e and 5 e edition of this Guide are currently used in the world). Balance of payments standards are uniform for IMF member countries, which include all developed capitalist countries, countries with economies in transition, and many others, Claiming a civilized attitude towards themselves as participants in world trade.
In general, in view of the uniform prices for measuring indicators of foreign economic activity in the balance of payments of various countries, analysis and comparison of countries as participants in international trade is possible. So, when studying the place of foreign trade in the economy and the degree of its openness to international trade, it is customary to compare the data of export, import and foreign trade of the country with the volumes of its GNP and / or GDP, the statistics of which, as a rule, it is supported in the country’s domestic prices and in international prices (US dollars) is translated on the basis of the exchange rate. For transitional economies, where in the process of liberalization of foreign trade and the transition to a market, domestic prices are adapted to world prices, the ratio of domestic and foreign trade prices at the initial stage of reforms has rather large gaps. On the one hand, liberalization of foreign trade allows the “import” of an undistorted system of world prices through the expansion of supplies from abroad of goods and services and thereby equalize domestic and world prices. On the other hand, when converting macroeconomic indicators into dollar prices, an official exchange rate is used, which in the context of market transformations, as you know, sometimes differs significantly from the actual used in conducting trading operations, which maintains price imbalances. All these factors, of course, affect domestic prices and impede the processes of comparing the macroeconomic indicators of a given country with other countries in uniform dollar prices.
In order to overcome the difficulties of comparison, in the practice of international organizations such as the World Bank and the International Monetary Fund, as well as the United Nations, for quite some time, the international methodology for comparing gross economic indicators in international prices has been used. The results of such calculations are regularly published in the relevant publications of these international organizations and are widely used in world practice (for example, when classifying a country as appropriate groups when evaluating the necessary financial assistance from international organizations, etc.). Noting that the study of these methods is not the purpose of this work, we will use macroeconomic indicators calculated using the two most well-known comparison methods, the calculation data of which are often used and commented, including Belarusian official media.
The first methodology calculates GNP and GDP (including per capita) and is called the World Bank Atlas methodology. Atlas conversion factor for any year is the average value of the country’s exchange rates (or alternative conversion factors in case, if the official exchange rate differs significantly from the actual one used) for a given year and exchange rates for the previous two years. Previously, these exchange rates are adjusted for the difference in inflation between the country in question and the countries of the five (Great Britain, Germany, USA, France, Japan), which is presented by changing the SDR deflator. This comparison of indicators for three years smooths out annual price fluctuations and exchange rates for each country.
The second calculation methodology is presented as part of the UN international comparisons program, which offers the measurement of GNP and GDP based on the international scale of comparisons using non-exchange rates as conversion factors, and purchasing power parity (PPP). The PPP-based conversion factor is defined as the number of monetary units in a given country, which is necessary to purchase as many goods and services on the domestic market as can be purchased in the United States on the 1 dollar. Sometimes the recalculation of domestic product indicators according to this methodology is called the transition to world dollars, bearing in mind that the gross indicators of different countries are reduced to the scale of US dollar prices.
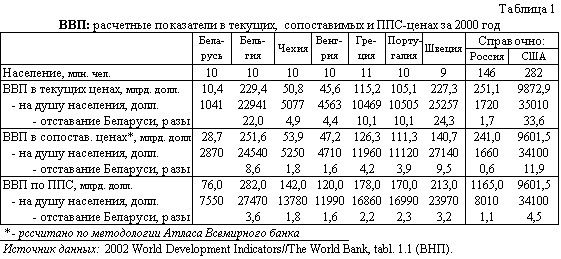
For example, if we compare the GNP indicators in comparable and current prices, as well as in PPP prices for countries with a population of about $ 10 million, which include Belarus, we get the next picture.
Data Source: 1 Table
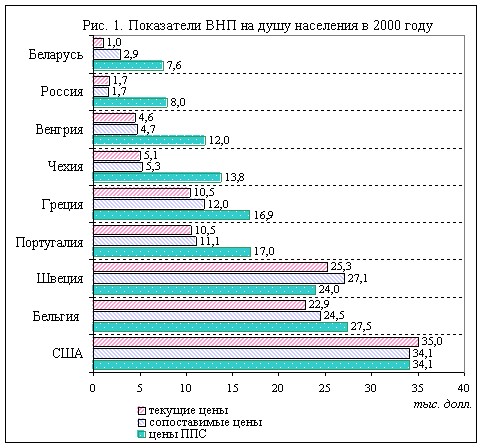
A comparison of the GNP per capita calculated by two methods is given in the table. 1 and in fig. 1 (pPS ranking). Among the countries for comparison are included, except Belarus, another 3 countries with economies in transition (Russia, Hungary, Czech Republic), as well as 5 developed countries (Greece, Portugal, Sweden, Belgium, USA). In all of these countries, except the United States and Russia, the population is about $ 10 million. It can be noted that for the group of countries with economies in transition, there is a rather significant gap between the values of per capita GNP indicators. So, at current and comparable prices, these indicators almost coincide (or vary slightly), while in PPP prices the gap is from 2.5 to 7 and more times (Belarus).
In developed and especially highly developed countries, such significant gaps are not observed. In addition, with regard to the differences between current and comparable prices for a group of countries with economies in transition, it can be noted that the gap is smaller, the more successful the country is moving along the path of reform and, above all, in the direction of relative stabilization of the exchange rate and reduction of inflation. So, in the three transitional countries of Hungary, the Czech Republic and Russia, there is practically no gap between current and comparable GDP in 2000, while in Belarus with the highest inflation in the group of CIS countries this difference is quite significant (almost 3 times). Thus, when comparing per capita GDP indicators in transition economies, you can level the effect of inflationary pumping of volume indicators and exchange rate distortions using comparable prices (as well as PPP prices) for calculating GDP.
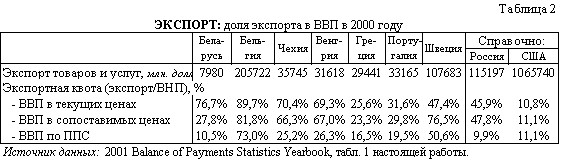
Further, usually when assessing the role of foreign trade in the economies of countries, the flows of export and import of goods and services are tracked at current dollar prices, i.e. at those prices, for which export goods were sold on foreign markets, and imported goods were purchased abroad. In this sense, export and import prices are world prices, international trade in goods and services on the world market is carried out on them. Usually, in view of the low dollar inflation, the current and comparable prices do not distinguish between foreign trade indicators, considering, that the difference between them is quite small and does not significantly affect the calculation results (especially when studying transition economies, where as a rule, own inflation is much more significant). Therefore, in the indicators for assessing the share of foreign trade in GDP / GNP (export, import, foreign trade quota), the numerator is presented at current dollar prices, while the denominator (GNP or GDP) can be expressed both at current and comparable prices, and in the PPP estimate.
As can be seen from the 2 table, the export quota (export to gross product ratio) practically does not differ from the types of GNP calculation prices for developed countries (difference from 0.3% for the United States to 16.7% for Belgium). At the same time, for transitional economies, different methods of estimating gross product make significant differences in the value of export quotas, where the difference reaches 66.2% (Belarus, calculation of GNP at PPP prices and at current prices). As can be seen from the 2 table, the Belarusian export quota at current GDP prices is really quite high and second only to the Belgian indicator. But after revaluation and bringing to a comparable form, the result of Belarus is the penultimate before Greece. And further, when using PPP-prices (the most popular for official media, since GDP is quite impressive for them), we get the last result in the table on the export quota, which for Belarus will be 10.5%.
We get similar results when considering the indicator of import quota at different prices of the domestic product (table. 3).
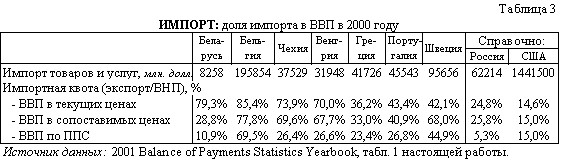
Thus, based on the fact that it is customary to assess the degree of openness of the economy and the impact on the domestic economy of foreign trade, the main conclusion for Belarus is, that the real dependence of the Belarusian economy on the export and import of goods and services is significantly less than is commonly believed in the analysis of data in the context of inflation-devaluation distortions of current prices.*