The result of the work of experts is usually a whole palette of opinions. The task of processing the results obtained involves finding an answer to two questions: the first is what the collective answer of the experts actually is, and the second is whether they can be trusted.
Depending on the content of the questions posed, the answers of experts can be quantitative or qualitative. Quantitative answers are obtained from experts when they estimate the predicted value using two types of scales – a ratio scale or an interval scale.
Estimates on the scale of relations are estimates in ordinary natural measures: meters, rubles, kilograms, etc. In this case, both the value itself and its difference from another similar value are informative. In other words, in the case of assessment on the scale of relations, we can talk about how large the estimated value is and how much it differs from another of the same value.
Scores on the interval scale are obtained in cases where the evaluated parameter cannot be measured by a natural measure, for example, the feelings and emotions of people. In this case, experts are asked to evaluate the predicted characteristic on some kind of digital scale. The absolute value of the resulting estimate does not make sense in itself, but the difference between the two such estimates indicates the degree of proximity of the two objects to each other in terms of the property being evaluated.
In both versions of the quantification, the method of processing the results is the same. To answer the question about the collective opinion of experts, an average value is traditionally used. But this value is not the best expression of the collective opinion of experts, since it can change greatly in the presence of very different opinions, especially in cases where these very different opinions are not symmetrical, i.e. the number of optimists is not equal to the number of pessimists. It is more correct to assume that the collective opinion of experts is more accurately assessed by the median. The median is a value that divides all the answers of experts in half, one half of the answers is less than the median, the second is more. Let’s illustrate this statement with the following example. We have estimates of three experts – 2, 3, 1. The median and average for them are the same and equal to 2. Now let’s add the opinion of the fourth expert, it is equal to 10. As a result, the average for the four answers is 4 and the median is 2.5.
The question of whether the opinion of experts can be trusted is answered by assessing the degree of consistency of their opinions. At the heart of this decision is a common-sense approach: we tend to believe the statements of others when everyone is saying the same thing, and not trust if each of them says something very different from the answers of the others.
In order to assess the degree of consistency of expert opinion, it is necessary to find the first and third quartiles. A quart in Latin is a quarter. The first quartile is a value that divides the answers of experts in the proportion of one fourth and three-fourths. One-fourth are answers smaller than the first quartile, three-fourths are all answers that are larger than the first quartile. The third quartile divides the experts’ answers respectively in the proportion of three-fourths and one-fourth. Three-quarters are answers that are smaller than the third quartile, and one-quarter are answers that are larger. To find the median and quartiles, it is necessary to sort the experts’ answers by increasing estimates and according to the series obtained in this way, it is necessary to build a graph of the dependence of the projected value on the number of experts. On this graph there are such values that separate the ?, ?, ? from the answers of the experts (Fig. 4.).
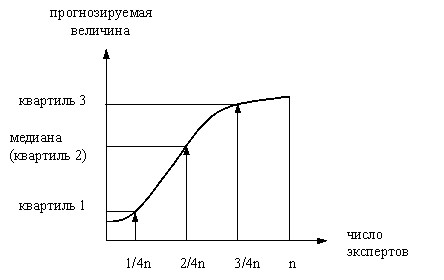
Rice. 4. Scheme for determining the median and quartiles.
The opinion of experts shall be deemed to have been agreed upon if the following conditions are met:
![]()
![]() and
and ![]() .
.
In other words, the opinion of experts is consistent if the difference in quartiles 3 and 1 is less than the median.